We reviewed all of the Google Sheets Dashboards templates available online to give you the best ones.
In this article, you will find the best templates for different use cases.
But before we kick things off, let’s understand what Google Sheets Dashboard is.
What Is a Google Sheets Dashboard?
Google sheets dashboards are used to store your kpis and metrics under one hub so that you can keep track of what’s happening in your company.
Dashboard are great for storing important data and visualising it so that your team have a place to monitor essential metrics for them.

In simple terms, suppose you have a pile of data waiting to be presented to teammates or stakeholders who prefer diagrams over numbers.
Now, processing the data manually might consume time, so Google Sheet dashboards help you quickly visualize your data via charts, graphs, pivot tables, and other stunning visualization tools.
However, GSheets are comparatively less advanced than KPI tools.
Why is that?
GSheets dashboards don't actually qualify the dashboard-specific features to track KPIs.
Instead, you need to do a lot of manual work to cope with the good work - GSheets have next to no automation.
But regardless of the limited customization and integration options in the Google Sheet dashboard, it does have an extensive library of dashboard templates to choose from.
Where Can I Download Google Sheets Templates?
Google Sheets offers a variety of dashboard templates ranging from educational to e-commerce templates.
You can easily find free templates on websites like SmartSheets, SpreadSheets, HubSpot, and more.
However, to ease your burden, we have already done the research and curated a list of 16 free Google Sheets dashboard templates available on the web.
16 Free Google Sheets Dashboard Templates in 2022
For your ease, we've divided the templates depending on their use, such as sales, analytical, KPI, project management, ecommerce, and finance dashboards.
Sales Dashboard Templates
#1. Customer Relationship Management Template
A CRM dashboard visually monitors your sales activity and KPIs including the individual performance of sales of team members.
If you’re looking for a system to organize your contact information, manage your sales process and automate certain tasks, you might need a CRM dashboard solution.

Customer relationship management
KPIs You Can Track
-
Opportunities: Tells about any business development process like sales of a product, increasing of press coverage and so on
-
People: Any contact who can do business with the company
-
Companies: An organization in which the people, you are in business with, work in
You can simply put your CRM data into this template and analyze it to improve your sales process.
#2. Monthly Sales Dashboard
Many teams rely on the weekly reports to track the progress of sales activity. It has to be updated continuously, which can be time consuming.
A monthly sales dashboard on Google Sheets, makes monitoring progress easy and accessible to the entire team.
The dashboard turns raw data into simple stats which makes it easier for teams to track their day to day progress with ease.

KPIs You Can Track
-
Monthly Trials: Number of users who signed up for a free trial per month
-
New Accounts: Number of visitors who signed up to your platform weekly and monthly
-
Monthly Recurring Revenue(MRR): Estimated revenue generated by your business from all the active subscriptions in a month
The monthly sales dashboard is mainly used by sales heads to make data driven decisions by measuring the real time growth of sales performance.
#3. Country Specific Sales Dashboard
A country-specific sales dashboard is a one stop solution to track the sales performance in a region.
It monitors the win ratio which helps the sales executives find bottlenecks in their go to market strategy for a specific city or country.

Country-Specific Sales Dashboard
KPIs You Can Track
-
Cumulative Revenue: Tracks and provides a visual representation of the revenue growth
-
Deals: A graphical representation showing the the status of deals which are open, lost or won
-
Win Ratio: Compares wins and losses and gives a clear idea of the final conversion rate
-
Total Deals: Shows you the total number of deals made and the revenue that came with it along with average deals made per day
Google Sheets Analytics Dashboard Template
#4. Running Analytics Dashboard
Without proper analytical strategy, data is just a string of random numbers.
Analytics dashboard helps you see the value of these random strings of numbers by making you track business-related metrics and KPIs.

KPIs You Can Track
-
Distance Over Time: Tracks the progress of distance covered over a certain time interval
-
Pace Over Time: Tells about the average pace by tracking the speed over time during different parts of day
-
Histogram of Elevation: Gains and losses over a set time period via bar charts
-
Total Runs: Percentage of runs you’ve had in every part of the day
-
Global Map: Marks all the countries where you run the business
#5. Website Traffic Dashboard
Website traffic dashboard tracks key metrics of a website like bounce rate, duration and more to tell which channels are performing better.
You can connect it with Google Analytics and get an insight into how users engage with your website.

KPIs You Can Track
-
Users: Total number of users visiting your website monthly
-
Sessions: Number of sessions you’ve had in a month
-
Bounce Rate: The percentage of visitors who leave your site after watching a single page
-
Page Views: The number of pages views by all users cumulatively in a month
-
Unique Transactions: The number of visitors who turned into buyers
-
Traffic Sources: Top 20 traffic sources of your website
It pulls data straight from Google Analytics to create a report on the performance of the website. Not only that, the dashboard also segments the user according to various sources like organic, paid and referrals.
#6. Website Paid Traffic
This template works very similar to website traffic dashboard. Except for the fact that this template only shows the traffic converted by paid searches.
It gives an overview of the number of users your website acquired via PPC (pay per click) and compares the organic conversion with the paid ones.

KPIs You Can Track
-
12-Month Trend: How many users you’ve acquired over a year via PPC and other channels
-
Medium Breakdown: Tracks all vital KPIs like number of sessions, users, bounce rate, session length, goal, etc.
-
Country Comparison/Session: Shows you the number of sessions you have worldwide (country-specific)
-
Device Breakdown: What devices brings you what percentage of conversion (desktop, tablet, and mobile)
If you want to track the performance of your paid results, you can add it to Google Analytics and get started.
Google Sheets KPI Dashboard Template
#7. Executive KPI Dashboard
A KPI dashboard displays performance metrics with interactive graphs and charts by analyzing key metrics and raw data.
An executive KPI dashboard not only saves time but provides valuable inputs that drive informed business decisions and relative growth.

KPIs You Can Track
-
Sales Overview: Track average and total sales monthly
-
Status: Number of sales that are close, open, and in-process
-
Annual Sales: Number of sales done each year
If you struggle to monitor your performance goals or if you are bored of using excel sheets to keep track of every metric, then the KPI dashboard is just the right tool for you.
#8. Marketing KPI Dashboard
Marketing dashboard measures your marketing campaign and helps you make smarter decisions backed by data, all in a single place.
With built in analytics and reporting tools, the dashboard provides you with everything you need to stay on top of things.

This dashboard template tracks the effectiveness of your marketing campaign for the week 07/01/2019 by measuring some key website metrics like:
-
Google Ad Spend: The amount you spend on Google Ads each month
-
Email: Compares and shows the total number of emails you send and the the subscribers you get from them monthly
-
Social Media: Total traffic you get from different social media channels
-
Weekly Sales: The source and number of sales you get weekly
Whether you are a solopreneur, or a big team, a marketing dashboard has everything you need to make your marketing campaigns effective to grow your business.
Google Sheets Project Management Dashboards
#9. Gantt Chart
A Gantt chart is a free project management dashboard template in the Google Sheets gallery.
It presents you with visual timelines and minute details of each task and its progress, easing your project management goals.

Gantt charts are good for planning and scheduling projects. That means you determine the project duration, resources needed, and the sequence of activities to be performed.
KPIs You Can Track
-
Project Schedule: The time it will take to complete the project
-
Current Resources Allocation: The number of resources to be allocated
-
Project Planning: To set goals, budgets, communication plans, and risk management over time
-
Project Performance: To align project objectives with deliverables, efforts, costs, and performance
Gantt charts can be used in almost every industry, including consulting agencies, marketing teams, design and creative projects, and event planning.
#10. Project Timeline Template Dashboard
A project timeline template is a modified form of the Gantt dashboard template. It mainly focuses on breaking down your project schedule in granular stages.

The template allows you to visualize each stage of your project and display key project information like active tasks, important milestones, task durations, and performance comparison in an easy-to-understand manner.
Plus, its diverse color-code presentation allows you to easily overview task status and progress over time. The template is excellent for planning, scheduling, and tracking important project KPIs.
KPIs You Can Track
-
Project Conception and Initiation: Includes project charter, plan review, and initiation
-
Project Definition and Planning: Includes goal setting, budgets, schedule breakdown, Gantt chart, and more
-
Project Launch and Execution: Involves status quo and tracking, future forecasts, and quality control
-
Project Performance and Control: Includes objective execution; effort, cost, and performance tracking
-
Project Close: Involves postmortem, punch list, and final report
The template is a good add-on to project managers, sponsors, and stakeholders to showcase project details on a weekly, monthly, or yearly basis.
#11. Event Marketing Timeline Template
An event marketing timeline template helps you organize and itemize different elements of multiple campaigns.
The template offers a wide range of categories, including PR, Local and National Marketing, content marketing, Market Research, etc.

Event Marketing Timeline Template
With an event marketing timeline template, you can easily monitor, manage, analyze, and include additional information for your marketing or sales campaigns.
For example, suppose you're planning an upcoming business event or increasing the number of campaigns. In that case, this template will help you cut down the time required to put-in information manually on your organizational sheet.
KPIs You Can Track
-
Ad Performance: Performance of banner ads, web ads, and more over time
-
Event Surveys: Involves results from market research and impact studies pre-campaign launch
-
Social Media Performance: Engagements gained from multiple social media platforms
-
Content Marketing: Results from sponsored content, landing page visits, newsletters, and online resources such as e-books, whitepapers, blogs, etc.
-
Sales Campaigns: Monitor the results from multiple sales campaigns at once
An event marketing dashboard template is best for marketing managers who are planning out multiple campaigns and require an organized dashboard for the same.
#12. Project Tracking Template
A project tracking template is yet another robust project management dashboard template available for free on GSheets.
This template allows you to customize the list of possible statuses and priorities to the right so that the Status and Priority columns can use standardized values.

The template segments your project tracking process into three measurable metrics:
Project Details
This is the segment where project tasks are delegated, details are provided, and progress is monitored. It has dedicated categories such as:
-
Project Status: On Hold/Not Yet Started/In Progress/Complete
-
Priority: Low/MediumHigh
-
Dates: Task allocation and completion dates
-
Assignee: The person who is responsible for the task
-
Description: A short brief of what is expected out of the task
Deliverables
Deliverables represent the completion percentage of individual tasks; the percentages are then compiled to measure the overall project completion percentage.
Cost/Hours
This segment determines the cost and hours required to complete certain tasks. It compares the estimated hours with the actual hours in which the task has been completed.
A project tracking template is highly beneficial for small or medium-sized enterprises that lack a skilled project manager.
Google Sheets Ecommerce Templates
#13. Ecommerce Template
With the explosion of Amazon, Shopify, Casper, and other online marketplaces, e-commerce has become the new normal in the United States.
Therefore, for e-commerce store owners, an e-commerce dashboard template is an excellent way to keep a bird-eye-view over their store's performance.

KPIs You Can Track
-
Customer Acquisition Metrics: Track total number of customers, new customers added, CPA, organic visitor acquisition, CTR, and more
-
Customer Behavioral Metrics: Track cart abandonment rates, checkout abandonment, conversion rates, average order value
-
Customer Retention Metrics: Focuses on customer retention rate, customer lifetime value (LTV), churn rate (the rate at which customers are leaving)
-
Operational Metrics: Includes Revenue, Variable Costs, Gross Margin, Gross Profit, Working Capital, etc.
Online store owners and managers use e-commerce dashboard templates to amplify their growth over time.
👉 Check out our article about which metrics you should track in your ecommerce KPI dashboard
#14. The Ultimate Ecommerce Metric Dashboard Template
Another excellent e-commerce dashboard template that breaks down your store's performance into five stages: Discovery, Consideration, Conversion, Retention, and Advocacy Stage.
The template walks you through every metric e-commerce brands should measure at each stage of their marketing funnel.

Ultimate Ecommerce Metrics Dashboard Template
KPIs You Can Track
-
Discovery Stage: How many people have come across the brand or the line of products?
-
Consideration Stage: What portion of people who came across the brand are engaging with it?
-
Conversion Stage: Which customer interactions with our brand are leading to a sale?
-
Retention Stage: What's the current customer retention rate, and how can we improve it?
-
Advocacy Stage: How do customers perceive our brand? (Net Promoter Score, Product Reviews)
This dashboard template allows store owners, managers, and stakeholders to measure monthly performance in each area. It helps them to identify the channels and efforts leading to a better ROI, thereby making better data-driven decisions.
Google Sheets Finance Dashboards
#15. Annual Budget Dashboard Template
An annual budget dashboard is a handy template that gives a detailed view of your business's expenditures and revenues year-over-year.

Annual Business Budget Dashboard Template
The template has a unique expenses analysis that allows you to compare your planned and actual expenses and thereby determine the variance or percentage of the variance between the two.
KPIs You Can Track
-
Income KPIs: Income generated from the sale of goods, fees billed, refunds, commissions and interest earned, and other income sources
-
Expense KPIs: Expenses incurred from advertising, promotions, bank charges, subscriptions, utilities, and other miscellaneous expenses
-
Summary: The sheet displays the summary of your spending from the data incorporated in your income and expenses sheet in an easy-to-understand visual format via graphs
An annual business budget template is primarily used by finance or accounting teams to present the business's annual financial position and budget to company owners and stakeholders.
#16. Monthly Budget Dashboard Template
If you're looking for a quick and easy budgeting tool, then GSheets monthly budget template is a great way to make an expense report.
The template allows you to enter your daily expenses and incomes with descriptions and categories for each transaction.
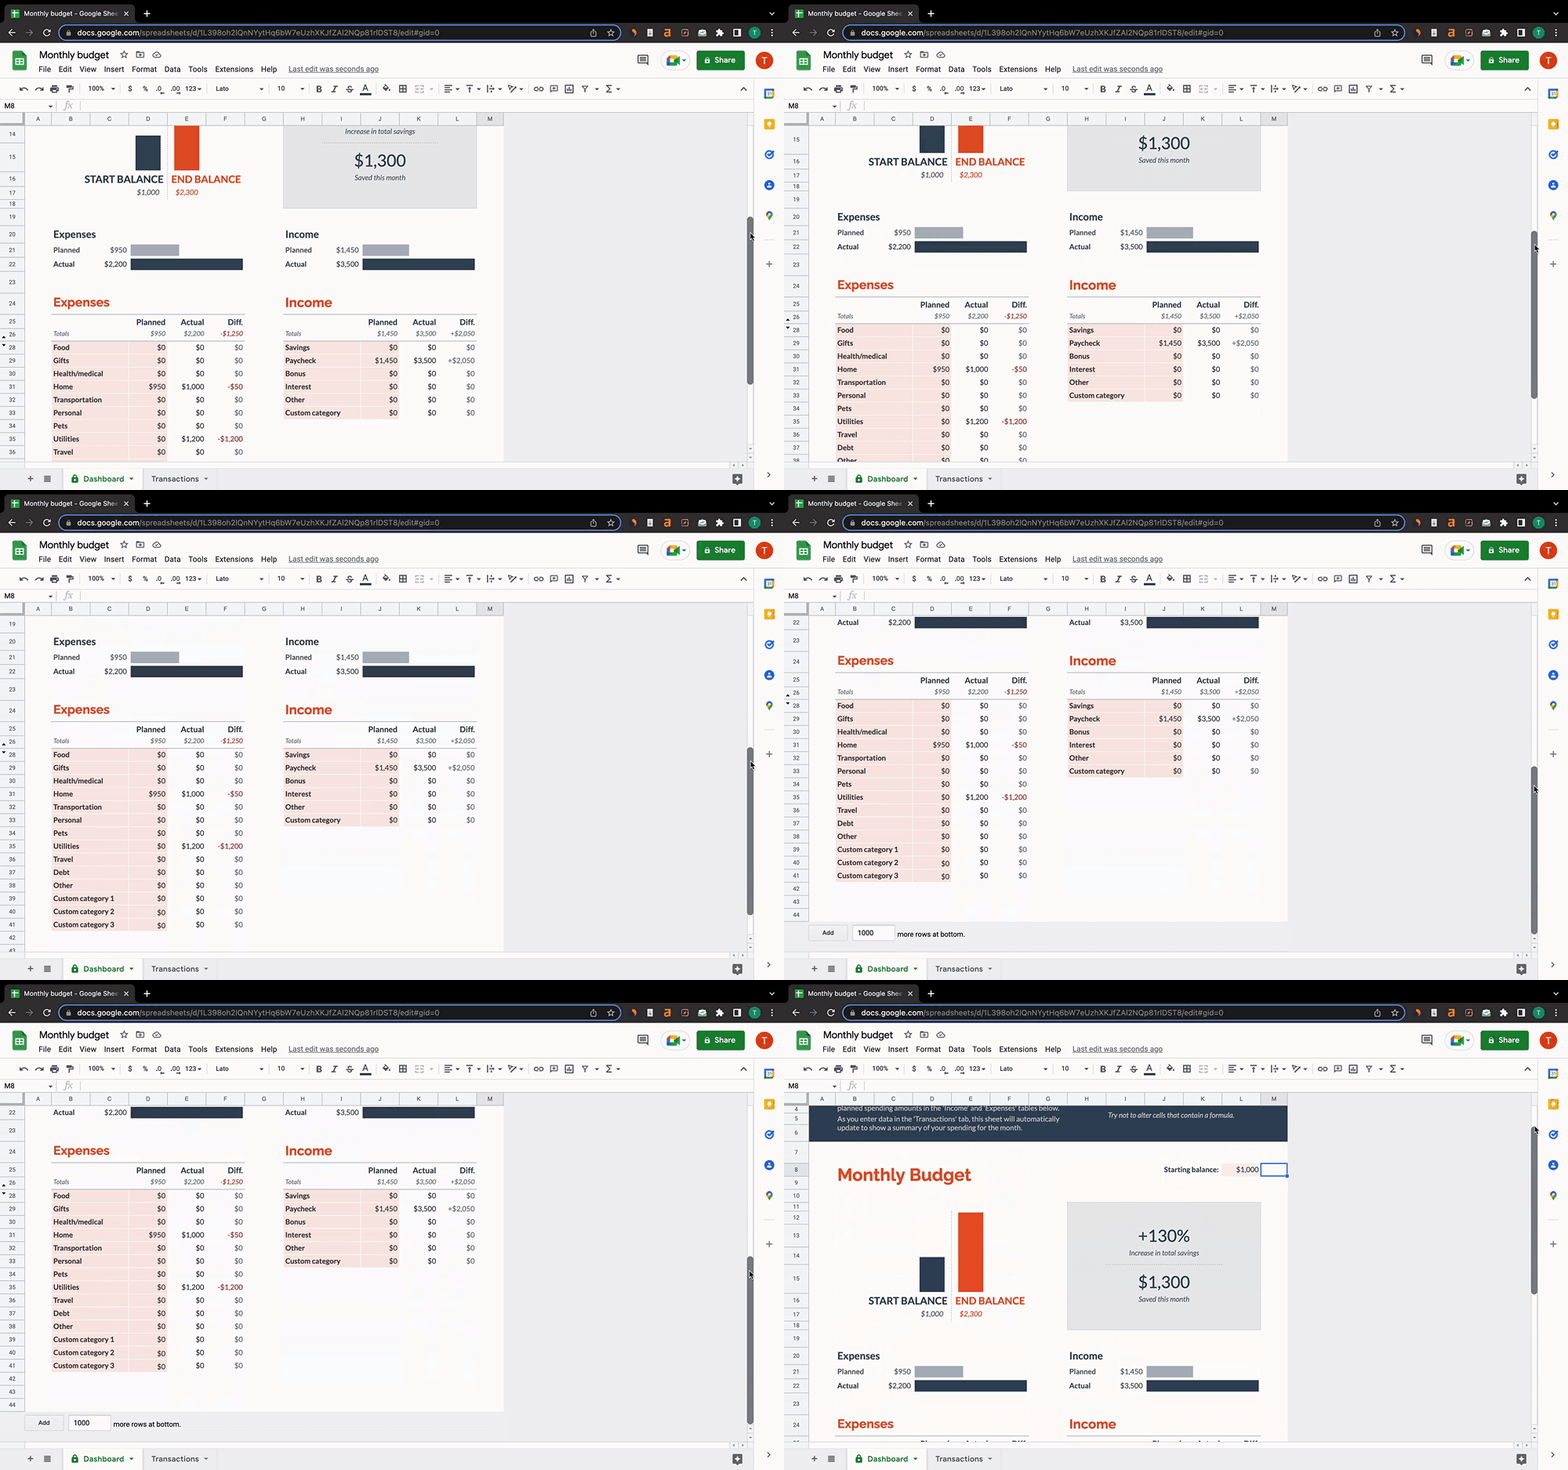
Monthly Budget Dashboard Template
You can easily change or add categories by updating the respective tables in the summary sheet.
The template also lets you automatically compile your data and present it in a unified dashboard as an overall budget, with stunning visuals.
The dashboard compares your starting and ending balance, planned and actual income and expenses.
It also presents you with the percentage increase in savings and the amount of savings for that particular month.
Where Can I Find Google Sheets Templates for Free?
#1. Template Gallery by Google Sheets
The easiest way to find free Google Sheets templates is in the built-in Template Gallery you encounter when you visit the Google Sheets page on the web. Here's what it looks like:
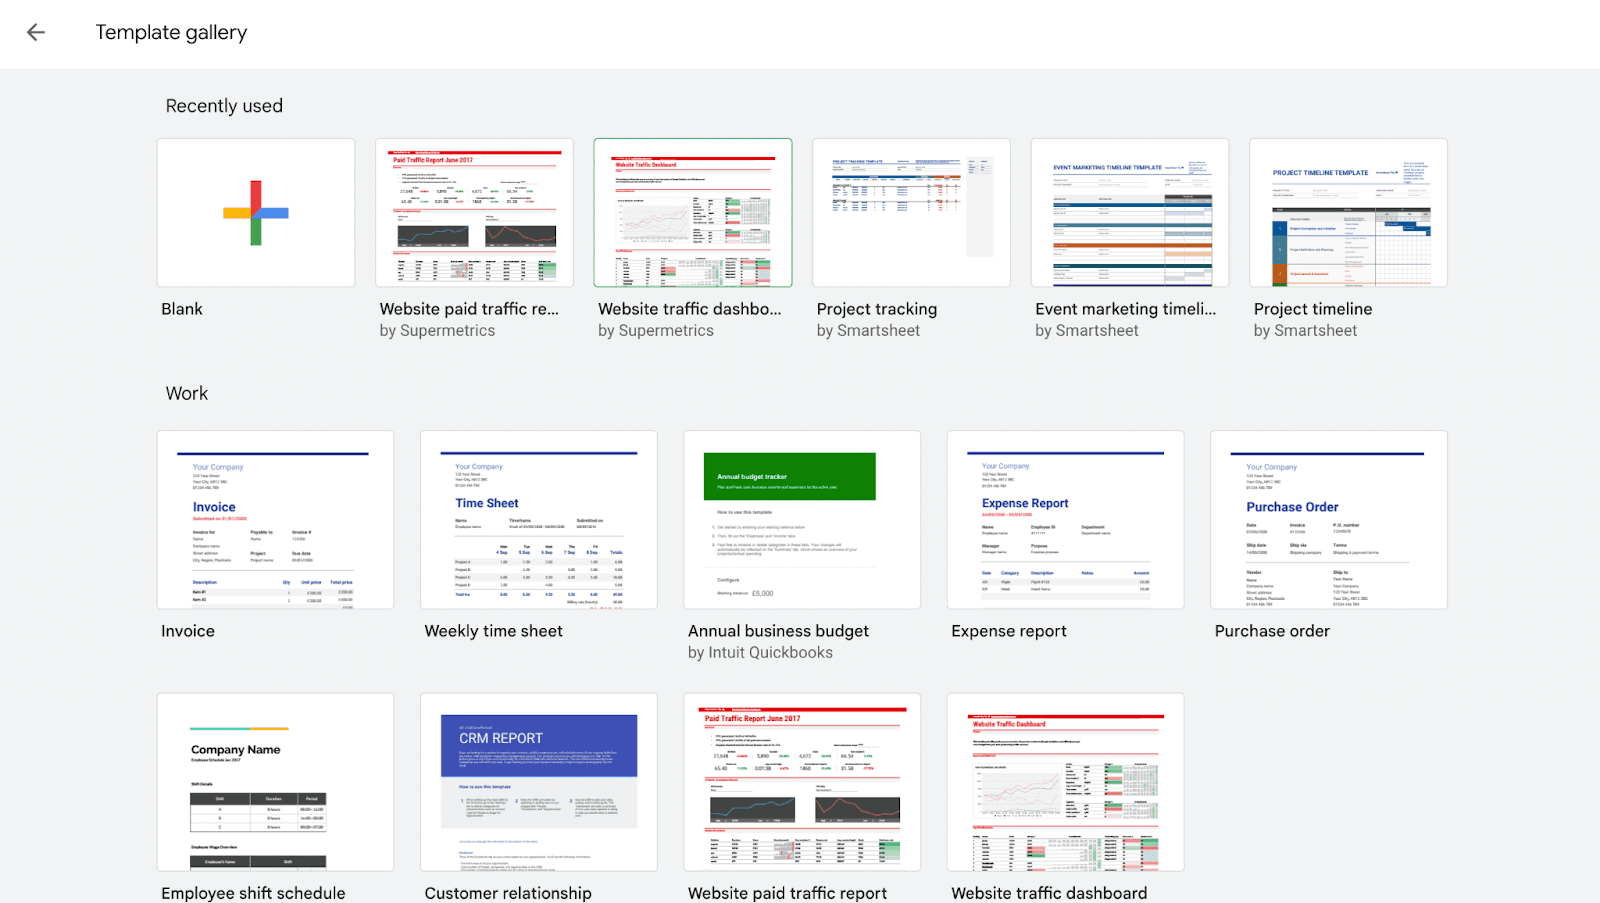
Accessing it isn't rocket science; just visit the Google Sheets page and click on the Template Gallery text you see in the top right corner.
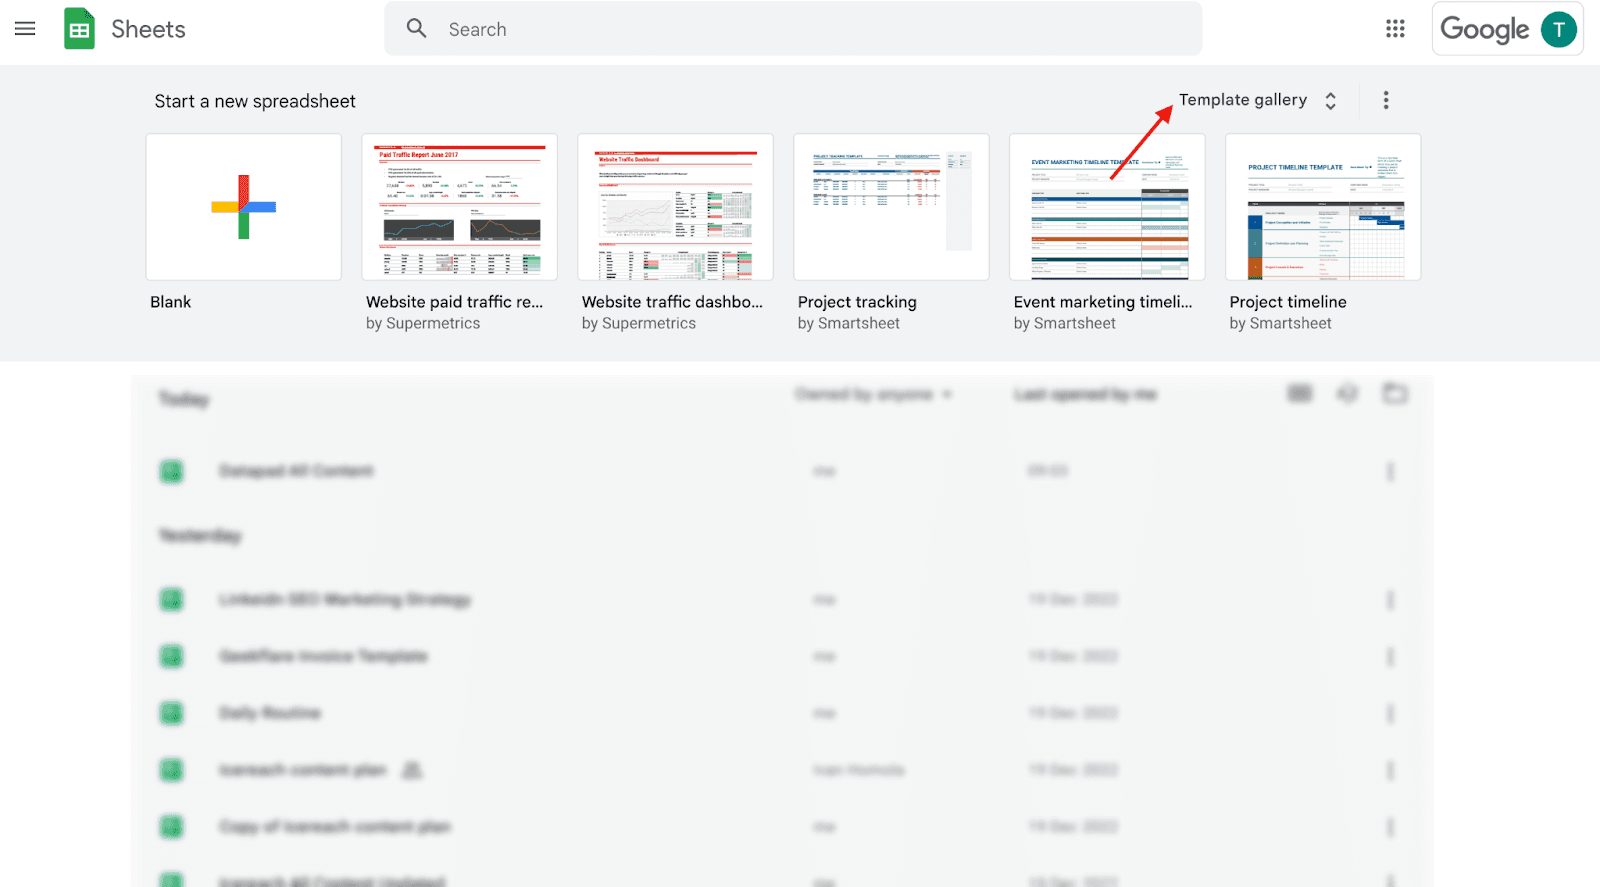
From website analytics tracking to project management tracking, the template gallery has everything you need. Although the options are limited, it’s a good way to test the waters before creating a dashboard.
#2. Good Docs Website
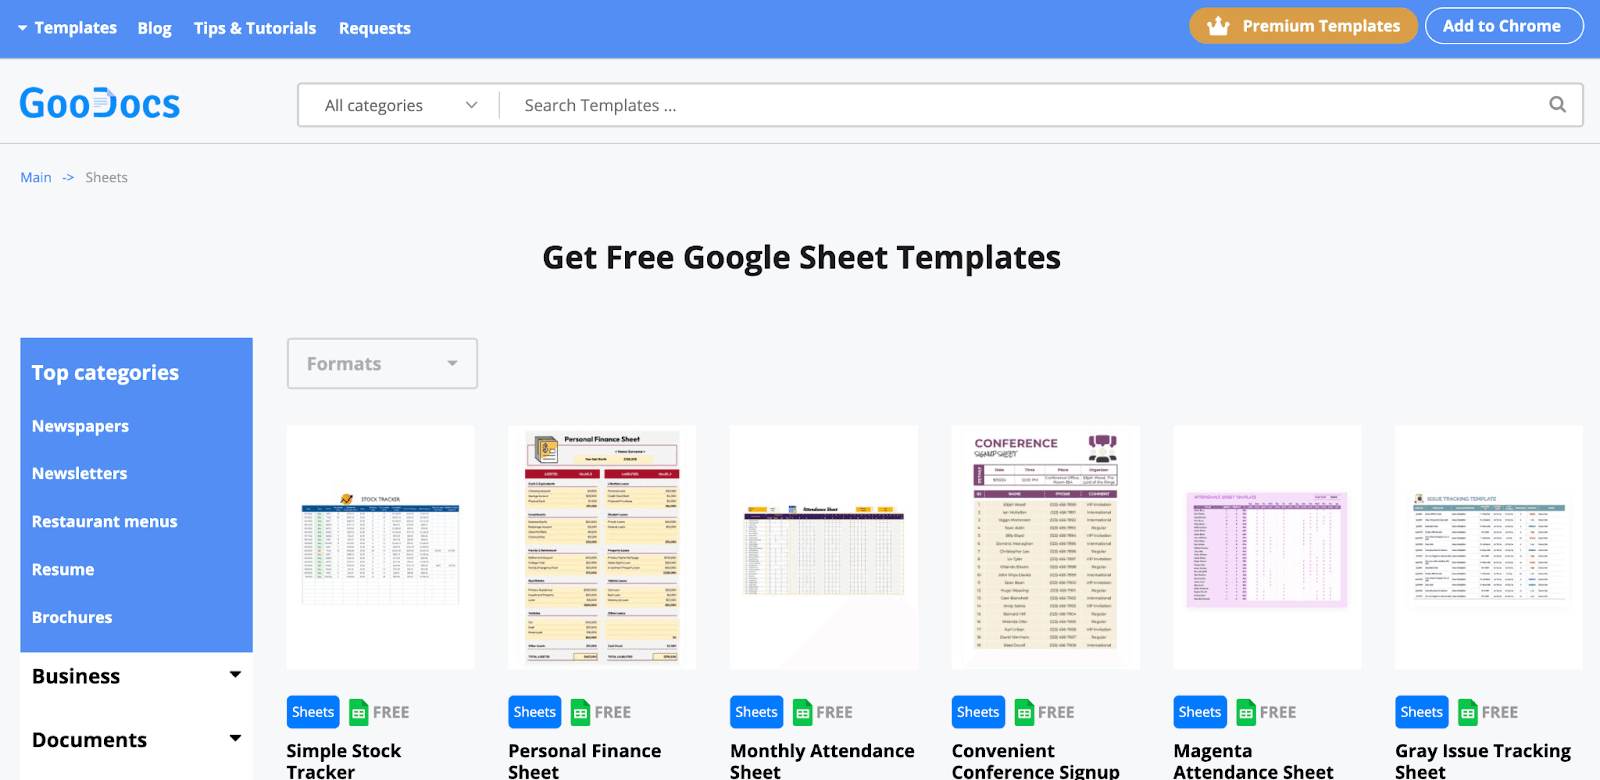
The Good Docs is a website that offers free Google Docs and Sheets templates. It’s a free source with hundreds of pre-build templates for sectors like sales, marketing, finance, and many more.
You can simply search for a template in the search bar at the top of the page, select the one you like, and download it.

Or you can also browse templates by hovering over the Templates menu icon at the top left corner.
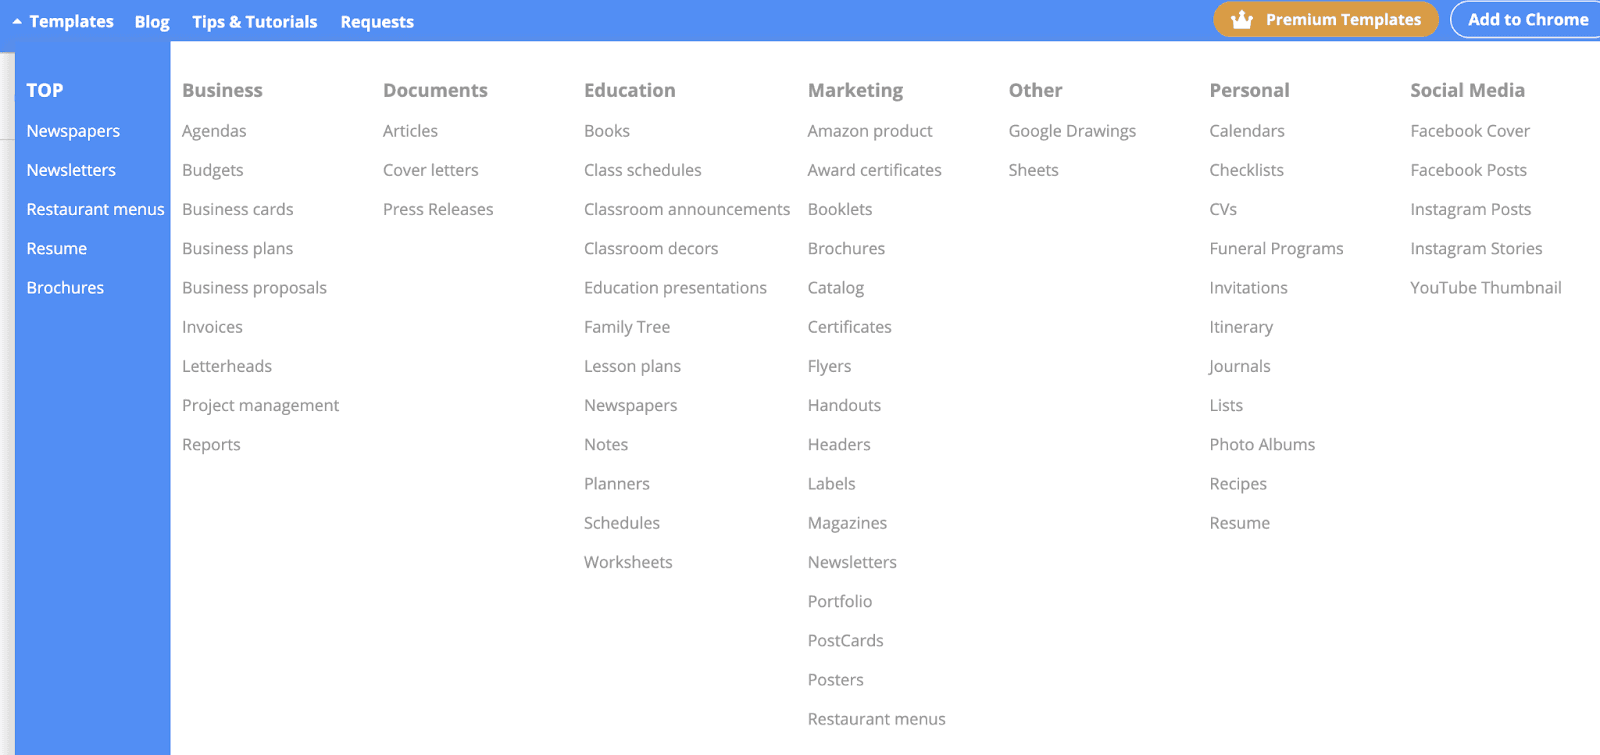
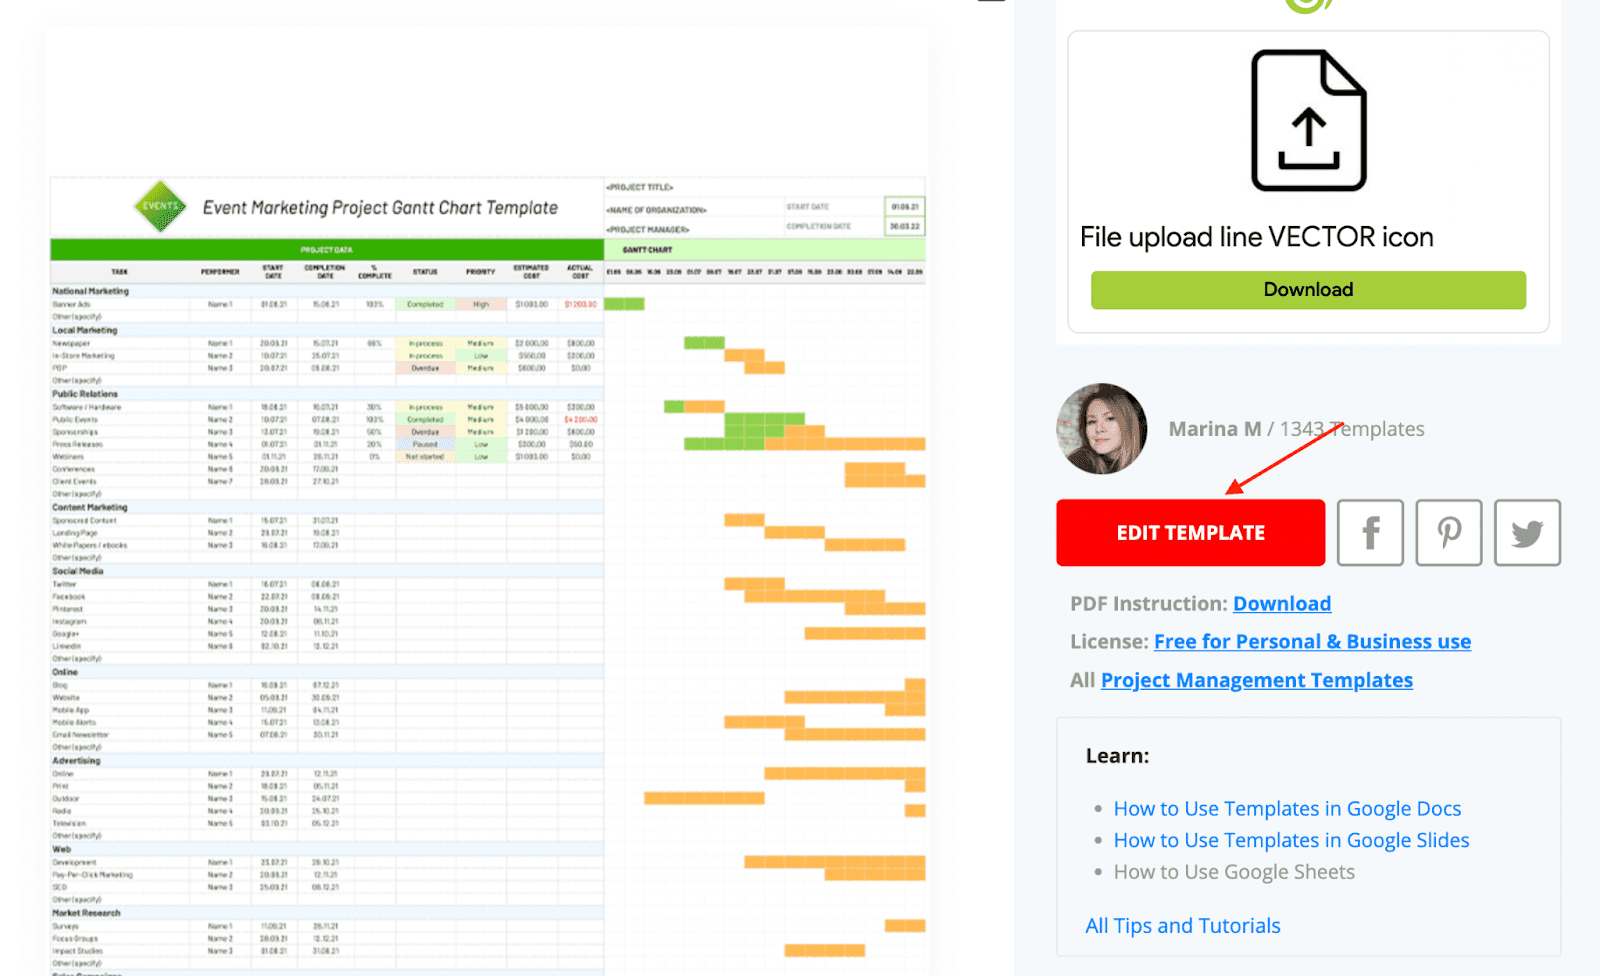
Once you’ve finalized which template to use, click on it. Go ahead and then click on Edit Template.
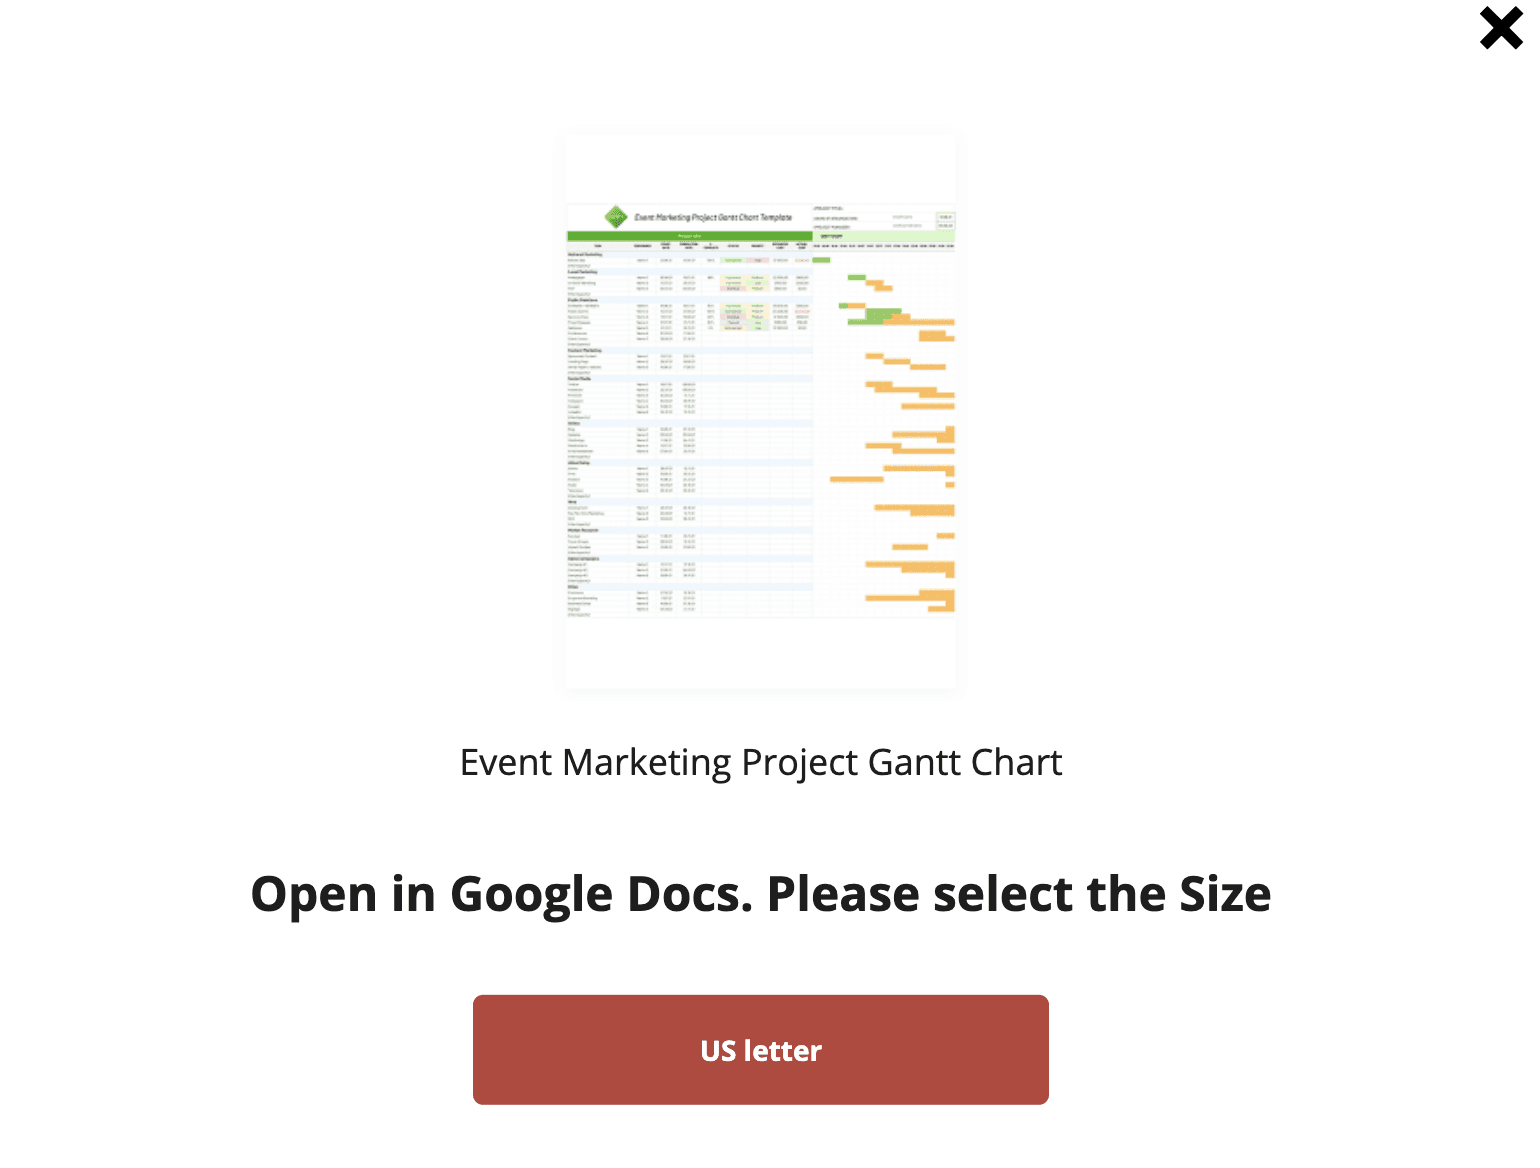
Select the format you want for your template. In our case, it's US Letter.
Wait for the template to download, and then click on Make a copy.

And just like that, you have a Google Sheets template ready for you.

#3. Template.Net

Just like Good Docs, Template.net is a website providing free GSheets templates. There are two ways to search for a template on this website:
First, you can carry out a manual search by typing in the name of the template you want.

Or you can filter results from the left side menu and choose the template you like.

Note: The filter option of Template.net is not powerful, so we suggest you use the good old manual search method to find the template you want.
#4. Google Sheets Add-Ons
Add-on in Google Sheets is another easy way to find free GSheets templates. All you have to do is follow the procedure below:
Open a new Google Sheet and go to Extension > Add-ons > Get add-ons.

Just type in Template in the search box and look for the text - Template Gallery for Google Sheets.

The first result is what you want to download.
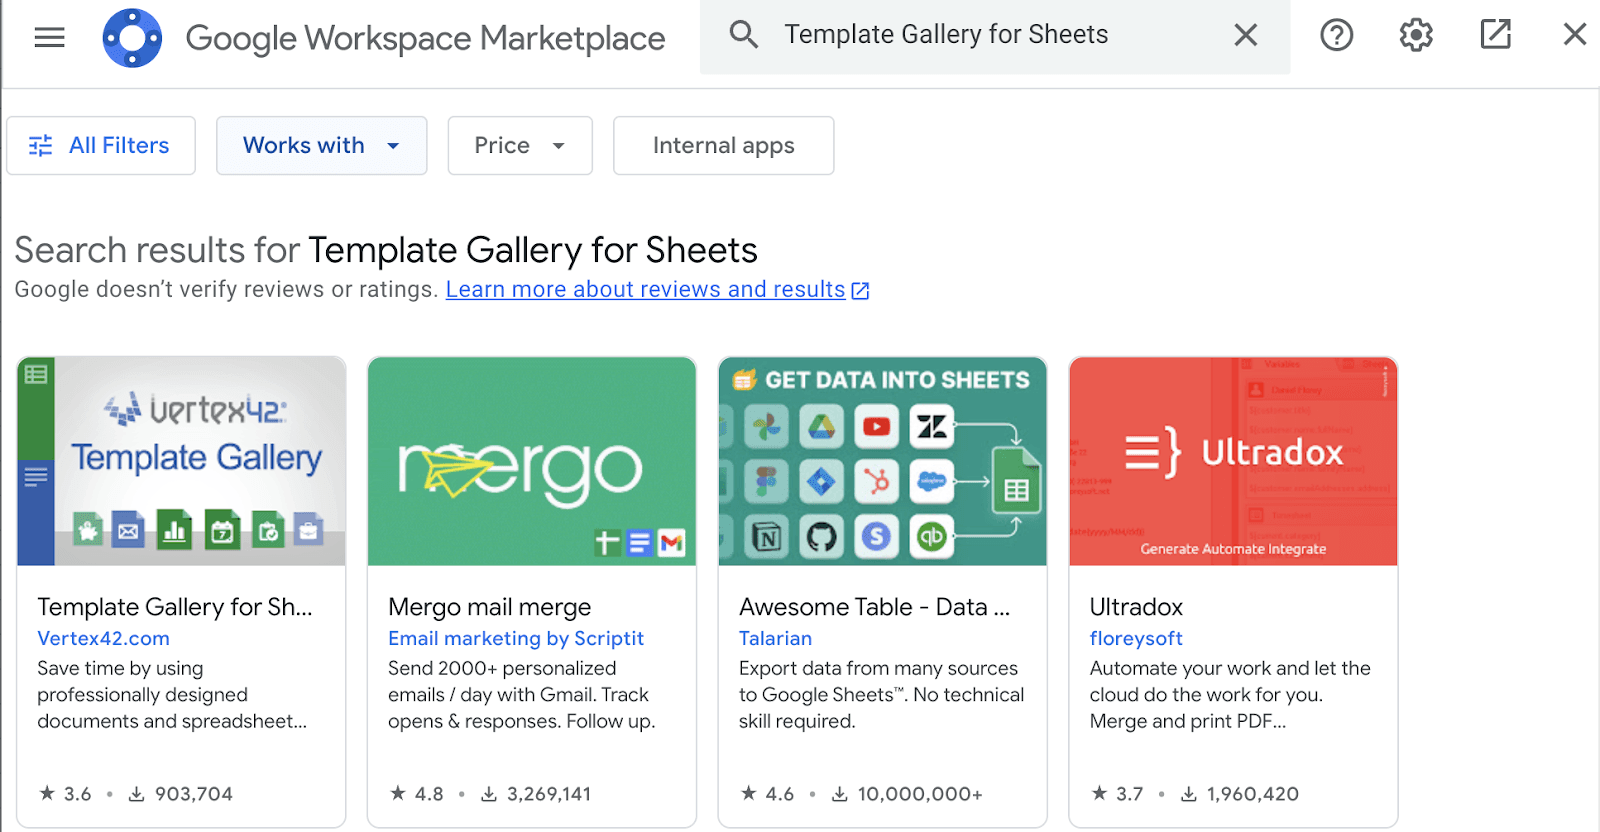
Go ahead and click on it and install the add-on.
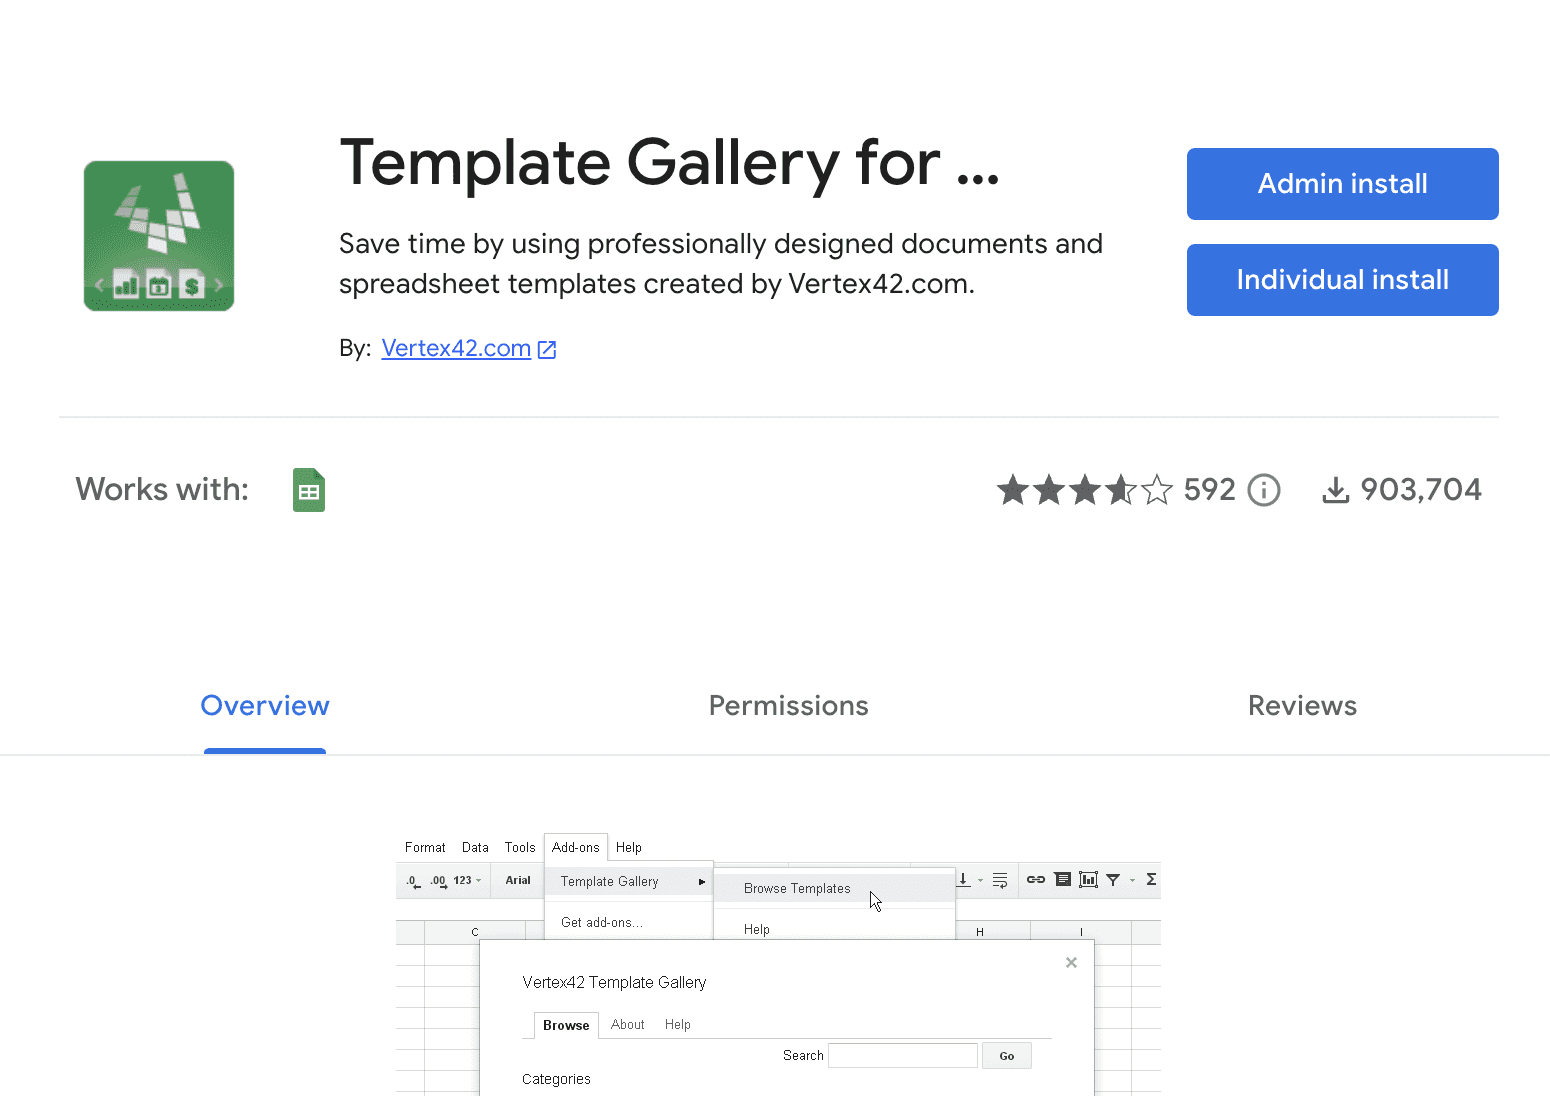
Note: It might take some time to install and integrate the template gallery with Google Sheets automatically.
After the add-on is integrated with Google Sheets, go ahead and click on Extensions > Template Gallery for Sheets > Browse Templates.

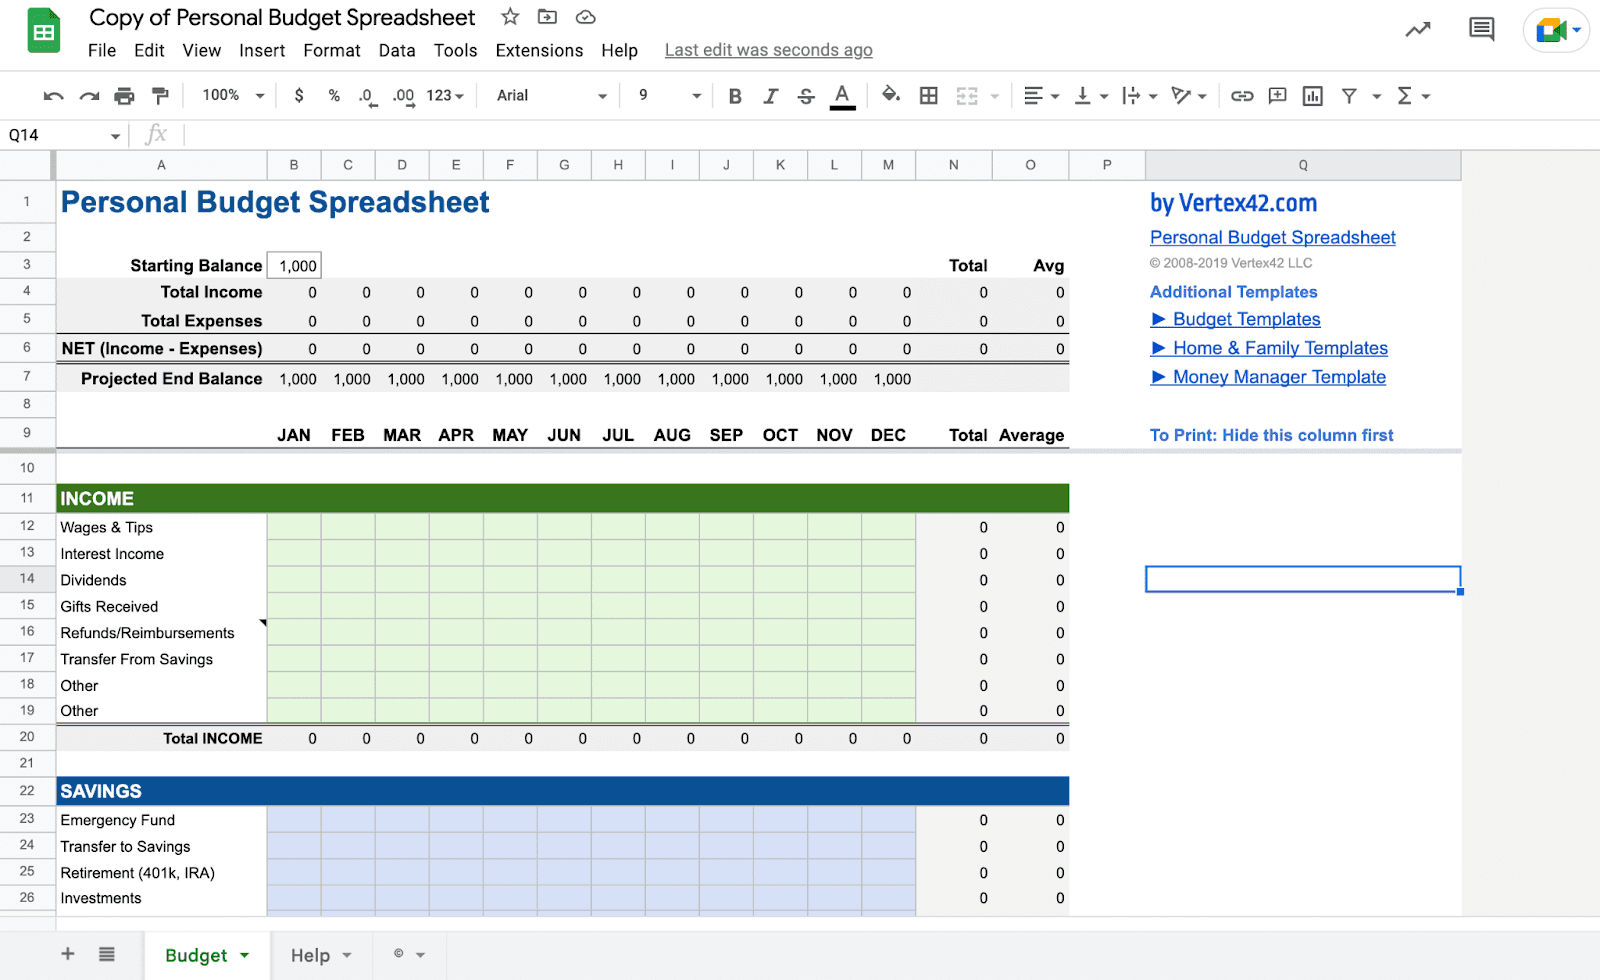
Choose the template you want, and it will be imported into Google Sheets.

For example, here’s a budget template.
What is the Drawback of Using Google Sheets Dashboard Templates?
Reason #1. It's All Manual
Google Sheets comes with next to no automation. That's bizarre because, being Google's prominent services, you expect it to be flawless.
But the sad truth is Google Sheets ain't a fully automated tool. For example, if you plan to automate your data input and tracking process, Google Sheets won't help you with any automation.
You need to manually input and edit every piece of data to your Google Sheet dashboard.
The most you can do is to create custom automation by playing with the script. However, that will require a certain level of coding skills. Your call!
Reason #2. Limited Functions and Formulas
We came across multiple customer reviews where they weren't impressed by the functions and formulas provided by Google Sheets dashboards.

Coming to functionalities and formulas, we came across another customer who found it overly complex to work upon.

Google Sheets definitely have limited functions and formulas. Even certain add-ons cost you a dime sometimes.
Reason #3. Few Integration Options
Google Sheets isn't very friendly with its third-party integrations.
Pro Tip: If you want optimum utilization of Google Sheets, it works best within Google's workspace - other integrations might pose problems.
However, if you are already set up with other applications, you might notice it takes extra time and syncs third-party tools with Google Sheets.
Till now, you might have understood how hard it is to build a dashboard on Google Sheets. Lucky for you, we have an easy, quick, and hassle-free solution for it.
Datapad: Have the Best Looking Dashboards Inside Your Pocket
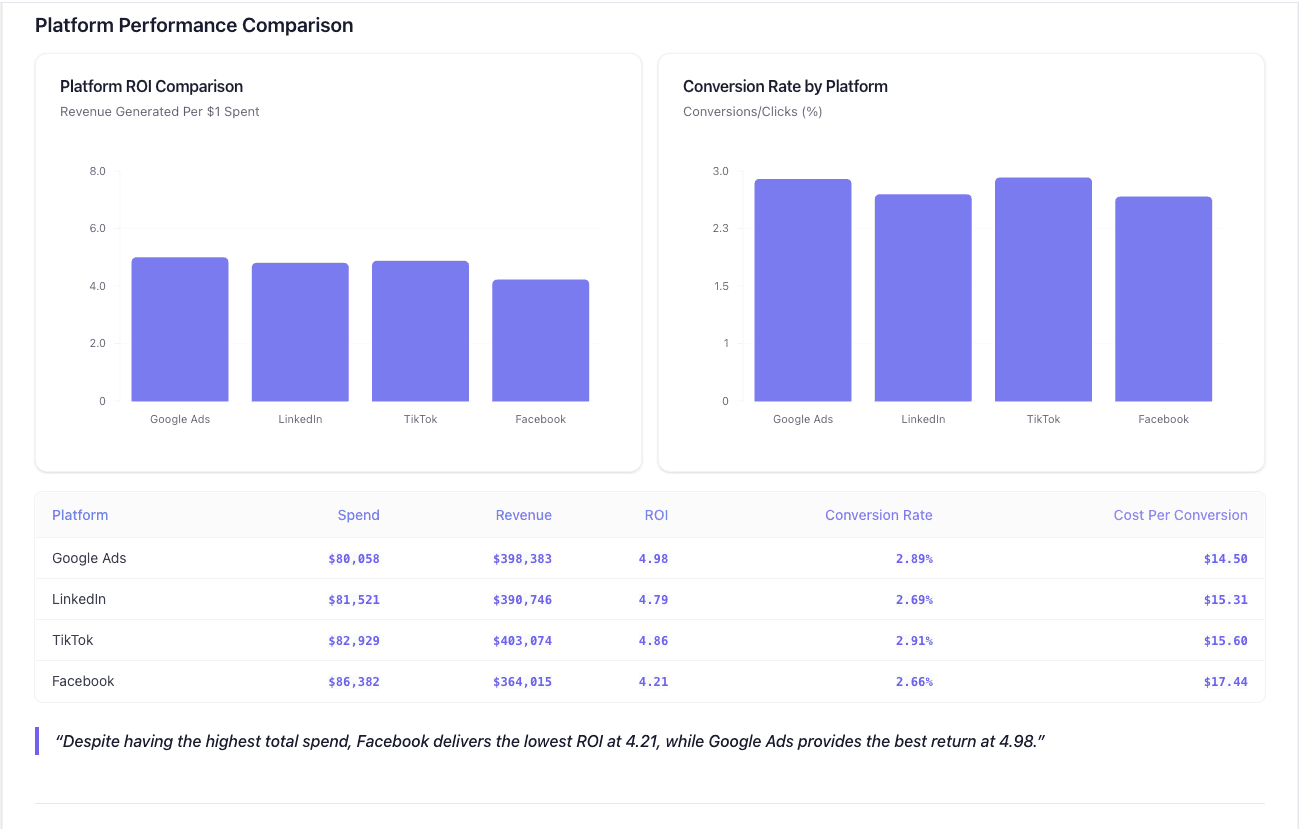
Datapad is designed to make data analysis easier, especially for those using Google Sheets. Whether you're creating a dashboard to track sales or a graph to visualize trends, Datapad integrates seamlessly with your Sheets to provide powerful insights.
The beauty of Datapad lies in its simplicity and ease of use. With our tool, anyone in your team with zero technical knowledge can start building reports in mere seconds.
#1. Google Sheets Integration:
Tired of copying and pasting data from your spreadsheets into visualization tools? Or worse, rebuilding your charts every time your data updates? Datapad solves this headache by connecting directly to your Google Sheets, transforming your data into stunning visualizations without the technical complexity.
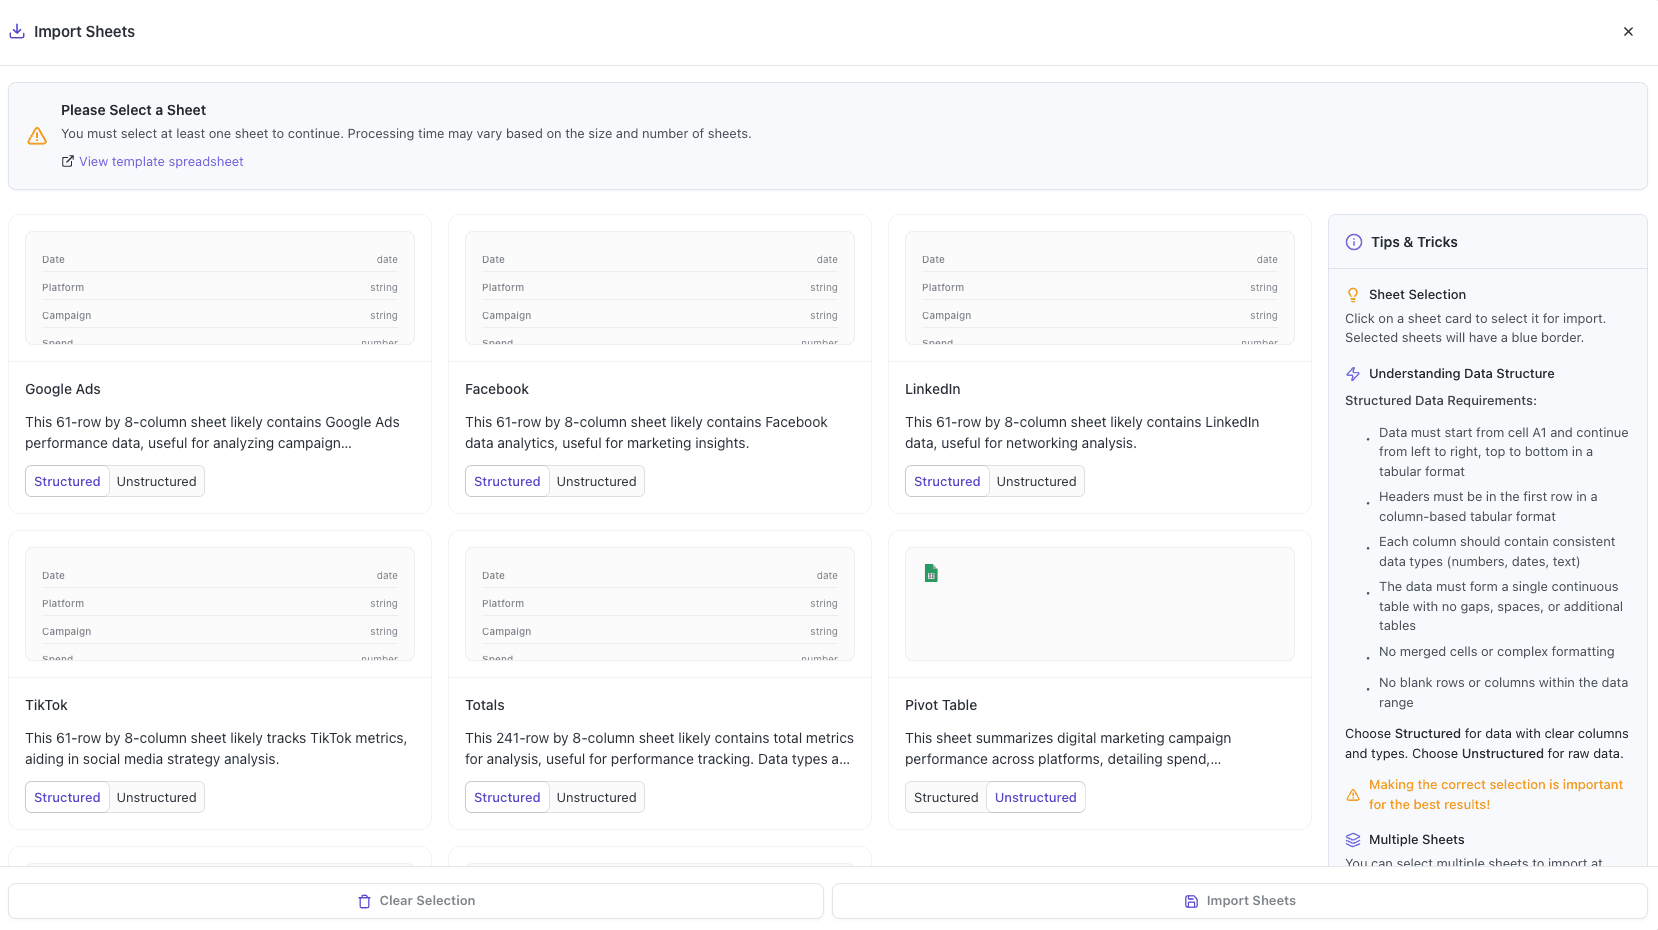
With Datapad's Google Sheets integration, you can:
-
Connect any Google Sheet with just a few clicks—no coding required
-
Watch as your dashboards update automatically when your spreadsheet changes
-
Visualize complex data in ways Google Sheets alone simply can't handle
-
Create beautiful, presentation-ready charts without fighting with formatting
Say goodbye to spreadsheet limitations and hello to data that works for you, not the other way around.
#2: AI-Driven Analysis
Ever wished you had a data analyst on call 24/7? With Datapad, you basically do. Skip the complex Excel formulas and simply ask questions in plain English like "What's our best-performing ad channel?" or "Show me last quarter's conversion trends." Datapad's AI instantly generates the perfect visualization to answer your question.
With Datapad's AI-powered analysis, you can:
-
Ask questions in everyday language and get immediate visual insights
-
Uncover hidden patterns and relationships in your data automatically
-
Focus on making decisions instead of fighting with chart settings
-
Transform complex data into clear, actionable intelligence in seconds
Your data has stories to tell—Datapad helps you hear them through simple conversation.
#3. Scheduled Reporting
End the monthly reporting grind forever. Datapad automatically delivers fresh insights straight to your inbox or Slack channel on your schedule. Set up your dashboard once and let automation take over—whether you need daily metrics, weekly performance snapshots, or monthly executive summaries. Choose from our library of ready-made templates to get started even faster with industry-specific KPIs and visualizations. Your team stays informed with zero manual effort, while you focus on acting on insights instead of creating reports. Perfect for agencies managing multiple clients or busy teams that need consistent data without the hassle.
Collaboration and KPI dashboards must go hand in hand, that’s how a company excels in KPIs tracking and setting strategic goals.
💭Food For Thought: We wanted to be innovative with our collaboration feature and thus spent hours brainstorming about how to make collaborations easy yet real-time.
So, here we are!
#4. Downloadable Reports
Sharing insights with your team or stakeholders should be straightforward. With Datapad, you can download your reports in PDF or HTML format, making it easy to distribute them. Whether you need to attach a report to an email, share it on a project management tool, or print it for a meeting, Datapad has you covered. No more scrambling to capture screenshots or manually compiling data. Your reports are ready to be shared in a professional format at the click of a button.
#5. Web Search Feature
Sometimes, understanding your data requires context from the wider world. Datapad's Web Search feature allows you to pull in external data for sector benchmarks and trends, enriching your analysis. Whether you're comparing your sales figures to industry averages or looking for the latest market trends, Datapad can help you find the information you need. This feature ensures that your analysis is not just based on internal data but also informed by external factors, giving you a more comprehensive view of your performance.Make Your Excel Dashboards Look Stunning with Datapad.
Table of Key Features and Benefits
| Feature | Description | Benefit |
| Google Sheets Integration | Connects directly to Google Sheets for data analysis. | Seamless workflow, leverages existing data. |
| AI-Powered Analysis | Allows plain English queries, generates graphs and dashboards. | Reduces technical barriers, fast insights. |
| Dashboard and Report Creation | Supports bar graphs, line charts, pie charts, Gantt charts, etc. | Visualizes data effectively for decision-making. |
| Scheduling Reports | Delivers reports via email or Slack at scheduled intervals. | Keeps users informed without manual effort. |
| Download Options | Reports available in PDF or HTML format. | Easy sharing with stakeholders or teams. |
| Web Search Feature | Pulls external data for benchmarks and trends. | Enhances analysis with industry context. |
Datapad is a free kpi dashboard tool that allows you to connect data sources and keep track of all your metrics in one place. We claim that Datapad is the easiest kpi tool out there.
If you are keeping your dashboards on excel or sheets, you can use our integration to take all your data from spreadsheets and build stunning dashboards on Datapad.
Frequently Asked Questions (FAQs)
Q1. How do I create a dashboard in Google Sheets?
We know you have this question in mind, and without wasting much time, here's a brilliant article that can help you create a custom dashboard in Google Sheets in just three steps.
Q2. How do I create a dynamic dashboard in Google Sheets?
Here're three easy steps to create dynamic dashboards in Google Sheets:Step 1: Import/collect data from all available data sources
Step 2: Visualize data with the help of - bar graphs, pie charts, histograms, etc.
Step 3: Publish it to the web or use the move to own sheet option to track KPI
Q3. Where can I download Google Sheets templates?
Here're our chosen options for downloading Google Sheets Templates:
You might also be interested to read these:
We Tested 9 Best Geckoboard Alternatives and Here’s Our Review [2022]
The Best 9 Databox Alternatives in 2022 [In Depth Comparison]
Operational Dashboards: 11 Tools to Stay on Top of Your Operations
How to Build a KPI Dashboard in Excel? [Here is the Easiest Way in 2022]
9 Best Metabase Alternatives in 2022 [In Depth Guide]
How to Create an Excel Dashboard in 2023 (Free Templates Included)
![Best 16 Free Google Sheets Dashboard Templates [2025]](/_next/image?url=https%3A%2F%2Fframerusercontent.com%2Fimages%2FG4potcMvzbgH6D0ziBDlWadGI.jpg&w=3840&q=75)