Despite coming from the same family of performance measurement, KPI and Metrics have different characteristics and are used by businesses in their unique ways.
Measuring success starts with choosing the right indicators. KPIs (Key Performance Indicators) focus on your most critical goals, while metrics track everyday data points. In this guide, you’ll learn:
1. Exact definitions of KPIs vs. metrics
2. 5 real-world examples illustrating their uses
3. 6 key differences you must know
4. Practical tips to track both effectively
Let’s dive in!
What Are KPIs? What Are Metrics? What is the Difference Between a KPI and a Metric? KPIs vs Metrics Examples? How Tracking KPIs and Metrics Can Help Businesses? Track Your KPIs Easily to Stay on Top of Your Business
What Are KPI metrics?
KPI metrics or KPIs are quantifiable measures used to gauge the performance or progress of specific business objectives or goals. They are specifically dedicated to 'Key' objectives and thus act as measurable benchmarks for long-term goals.

A good KPI metric should act as a compass helping you and your team understand if you're making the right decisions and heading the right way.
So what goes into a good KPI?
More or less, good KPIs inherit the following characteristics:
-
Provides statistical evidence of progress towards long-term goals
-
Measures key business objectives to help make informed decisions
-
Offers a comparison that measures the degree of performance change over time
-
Equally balanced between leading and lagging indicators
Note: Leading KPIs can help predict outcomes while lagging KPIs track what has already happened. Organizations use a mix of both to track what's most important.
Moreover, KPIs specifically help determine a company's strategic, financial, and operational achievements compared to its competitors.
From HR and managers to marketing and sales teams, key performance indicators help every area of the business move forward at the strategic level.
Although KPIs are subject to business operations and strategic goals, there are some that remain in common while measuring business performance.
Examples of KPIs:
-
Revenue KPIs: Measure the revenue earned by the company over time
-
Sales KPIs: Measure how sales are increasing or decreasing over time
-
Strategic KPIs: Measure the performance of strategies put in place
-
Profit Margin: Evaluate how much profit you make per sale after deducting expenses
-
Customer Service KPIs: Evaluate the impact of service on your customers and identify drawbacks
Majority of KPIs are used to track your business performance, such as conversion rates, monthly sales growth, net cash flow, customer acquisition cost, and many more.
But to identify the most resourceful list of KPIs you will be tracking, you need answers to specific questions like:
-
What is your ultimate business objective?
-
Why does this objective matter?
-
How are you planning to achieve this objective?
-
How will you know if you're making progress towards the goal?
-
How often will you review your progress?
For example, if your business goal is to increase revenue by 20% by the end of the year, your KPIs to measure your goal may include monthly sales qualified, upselling success rate, customer acquisition cost, customer retention rate, and customer churn rate.
In other words, a KPI can be a mix of multiple business metrics. Talking about metrics, let’s see what those are.
Related: What is KPI?: Beginners Guide You Have Been Looking For
What Are Metrics?
Like KPIs, metrics are quantifiable measurements, but unlike KPIs, they are used to measure the performance of specific business processes at an operational level.
While some metrics closely accompany business objectives, they are not the most important indicators of your business performance.

For example, the number of users visiting your website is a critical metric to cover. But it's not something that drives the success of your business primarily.These metrics are called vanity metrics that just make you feel good.
However, metrics are still relevant for tracking progress and making informed decisions.
Simply put, metrics are any type of data collected as a part of routine business operations. And hence, a mix of custom metrics can be used to define long-term KPIs for your business.
Our curiosity made us drill down a bit to identify why metrics are as crucial as KPIs, and we came across three significant reasons:
-
Metrics provides in-depth insights into how well particular campaigns, strategies, and activities are performing
-
Metrics allow you to gauge business performance against competitors
-
Metrics helps organizations identify the KPIs that are most important to an organization's success and how they interlink to each other
For example, Email deliverability may not be an important KPI for your business, but the number of emails that convert to customers most likely will be. Therefore, you need to analyze that metric (deliverability) to achieve the KPI (email conversion).
Let's now see the difference between metrics and KPIs.
What is the Difference Between a KPI and a Metric?
Although some people use the terms KPI and metrics interchangeably, they aren't the same.
While metrics are units of measurement used in deriving KPIs, KPIs are metrics with a set goal for a certain period of time.
Or in general terms, we can say, Every KPI is a metric, but not every metric is a KPI.
Food for thought: Context is where the most significant difference lies.
The difference is:
-
Metrics are effective for tracking performance across all areas of business
-
KPIs are effective for monitoring performance towards a specific goal or objective
If this wasn't something you were looking for as a differentiator, we have compiled a list of five key differences between a metric and key performance indicator, and it goes like this:
#1. Goals and Data Points
KPI is a business outcome or goal that a specific department or team tries to achieve. Whereas metrics are scattered data points in your funnel that, when collected together, create a KPI.
Suppose you aim to achieve 500 registrations for your webinar by the end of the week. But to track that one goal, you need to measure the number of sign-ups, the number of website visitors, click on the ads (if you run PPC), and the conversion rate of the webinar landing page.
Here, the ultimate goal of 500 registrations is your KPI. At the same time, the other measurements, like the number of sign-ups, website visitors, etc., are your metrics.
A combination of specific metrics helps you define your progress towards your goal (KPI).
#2. Determined Timeframe
KPIs are tied to essential objectives and measure progress over a set period. On the other hand, metrics aren't necessarily bound to important goals or time frames.
KPIs are something that you want to achieve over the long term. For example, let's say you want to increase the number of customers by 50 over the next 90 days.
That sounds like a specific goal with a determined time frame - apt for being a KPI.
While metrics are just informational data such as likes on social posts, number of shares, pages per visit, and more of the same nature.
But it's not like you’re targeting these metrics for a cause or KPIs; you are tracking them as a part of your day-to-day operations in the digital paradigm.
#3. Level of Focus
The most apparent difference between KPIs and metrics is that metrics are broad and KPIs are focused.
When it comes to level of focus, KPIs and metrics are poles apart. In simpler terms, KPIs focus on results, while metrics concentrate on processes and problems.
The reason being, KPIs offer a high-level perspective for performance measurement. They represent key business goals and define activities and responsibilities for almost every department in the organization.
On the flip side, metrics are considered to be low-level indicators. They usually deal with day-to-day business processes and are specific to certain departments or business areas.
#4. Superiority - Metrics vs KPI
Although KPIs and metrics go hand-in-hand, one is superior to the other. Let's understand it in this way.
Suppose you're watching a movie; some characters appear less often, some appear in every scene, and then there are main characters, heroes and villains who steal the charm.
Here, the main characters are your KPIs, while others are your metrics - both bring something to the table, but not equally.
Your ultimate business goal (KPI) is what defines your metrics revolving around them. And we may conclusively say KPI has the upper hand while strategizing your business plan.
#5. Every KPI is a Metric, But Not Every Metric is a KPI
Just like John McEvoy quotes,” All tequilas are mezcals, but not all mezcals are tequilas.” (😉)
KPIs and metrics share the same relation.
For example, let's imagine that metrics are individual players that make up a soccer team, but the goalie is your KPI. These metrics make up the team and support your KPI.
In this example, the goalie (KPI) is tied to a specific objective despite being a player (metric) - that’s to protect his goal post at all times.
But you can't win if the other players (metrics) are not supporting your KPI.
Although there's a fine line of difference between KPIs and metrics, we have summarized the above points to get you everything at a glance.

Measurements vs Metrics: How Are They Different?
Measurements and metrics are two interlinked scenes of the same movie; without seeing the one you won’t be able to understand the other.
Meaning, for a business to track any kind of progress, you need both measurement and metric. But are they the same?
Short answer: No they’re not. ❌
Long answer:
A measure is a classification of raw data such as a number or a value which can be calculated using mathematical formulas.
For example, in marketing, sales, cost, and profits are measurements you do to get a vague estimation about any business.
On the other hand, the end result of metrics is also a number but it’s ‘specific.’ Metrics are quantifiable measurements used to measure business performance.
So the main difference between measurement and metric is, measurement gives you a vague number but metrics give you specific numbers.
Typical examples of metrics: Increase in website traffic, decrease in bounce rate, etc.
Using Measures and Metrics in Tandem 🤝
Oftentime, to track business performance in any vertical, using measures and metrics in tandem is advisable. That’s because when you use them together you get ‘specific measurements’ and not just measurements.
Here’s an example for you to understand it better:
Instead of just tracking sales (measurement), track sales of product A in July (measurement + metric).
Tracking both these elements is beneficial for investors, share holders, and even your team.
Imagine showing a dashboard to an investor that has just Total Sales - $400,000, the very next question they might ask you is where’s the monthly sales?
That’s where metrics come into the picture.
When you show your investors the month over month sales by combining measures and metrics, your investors are able to see the growth you’ve had over the months - a very crucial metric, when it comes to investment.
KPIs vs Metrics Examples
Now that you know the differences between KPI and metric, and understand why both are crucial for performance measurement. Let’s take an example to elaborate how they help in measuring specific objectives.
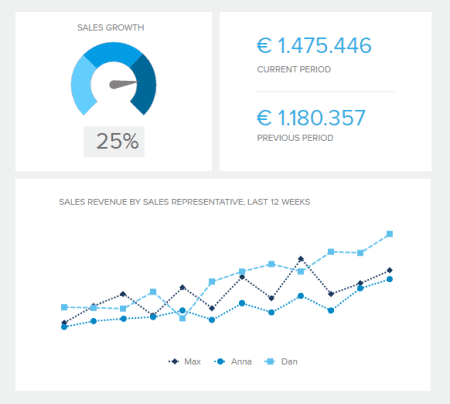
Suppose you're trying to achieve a big sales goal, let’s say increase sales by 25% in 12 weeks. This goal is relevant to various departments across your business, and each of these departments will track multiple metrics to measure how their activities contribute toward the goal.
Let's see how KPI and metrics are used here.
KPI: Sales Growth

The image above is a visual representation of the main KPI: sales growth.
Here, you can compare the sales made from the previous period with the current sales made by individual sales reps and the percentage increase in sales over time.
Although KPI can be used to measure sales growth, to drill down your analysis, you need to figure out how different activities fall in line with your ultimate goal. This can be done by measuring specific sales metrics.
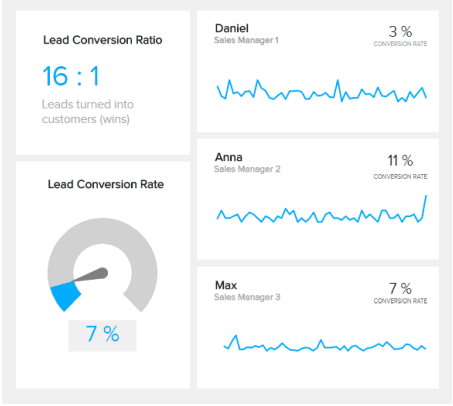
Metrics: Lead to Conversion Ratio

In this case, the lead-to-conversion rate is an excellent metric to track. It measures the number of leads that turned into paying customers, thereby adding to sales growth.
The lead-to-conversion metric provides deeper insights into how and what amount of leads are converting into customers.
The metric also presents you with employee insights, such as what percentage of leads were converted into actual customers by an individual sales rep.
This allows you to get a broader perspective of who contributed more towards the main goal: sales growth.
Likewise, you can use metrics such as lead-to-opportunity ratio, net profit margin, monthly sales, and more of the same nature to drill down on the low-level performance that took place to accomplish a high-level goal.
Read more: KPI Examples: Here Are the Best 30 You Can Find in 2022
How Tracking KPIs and Metrics Can Help Businesses?
Making online business decisions based on assumptions is no better than walking in a maze blindfolded. You're in no control of where you are heading, but you know you're heading somewhere. The same goes while tracking KPIs and metrics.
For the most part, tracking KPIs and metrics can help you stay in control of your business while allowing you to make better data-driven decisions.
Here's how they help in a nutshell:
#1. Monitor Company's Health
While you might think of this as a time-consuming process, you just require a handful of KPIs to monitor your company's health, such as:
-
Financial KPIs: Measure and compare previous and present financial metrics to drive revenue growth
-
Employee KPIs: Measure employee productivity and happiness to evaluate the company's working environment
-
Customer Success KPIs: Measure how your services are doing for your customer and figure out ways to improve
These KPIs fall under metrics such as customer retention rate, net profit margin, and more of the same nature. Moreover, they can easily gauge your business health over a given period.
#2. Measure Progress
Key performance indicators can immensely help you measure your business's progress towards pre-determined goals or objectives.
All you need to do is set the right KPIs and track critical metrics like Revenue, Gross margin, and compare past and present performances to measure progress.
Metrics give businesses in-depth insights into how well particular campaigns, strategies, and activities are performed. This helps managers identify areas where they need to make changes for better results.
#3. Make Adjustments
There might be times when a wrong decision can derail your business. However, tracking KPIs and performance metrics allows you to be in control of what's working for you and what's not.
Tracking KPIs and metrics such as leading and lagging indicators at certain intervals can help you identify pain points and determine the future course of action for the better growth of your business.
Track Your KPI Metrics Easily to Stay on Top of Your Business
Datapad is an intelligent AI data analyst agent. Ask questions in plain English to build custom dashboards and reports, with Datapad handling the SQL and Python when needed. Blend data from 50+ integrations and schedule deliverables to arrive in your email or Slack on a precise cadence (e.g., every month’s first Monday at 10:00 AM). You can also run AI anomaly detection to surface unusual patterns worth investigating.
- Natural-language to dashboards & reports. Describe what you want; Datapad generates visuals and the underlying SQL/Python.
- Blend data across sources. Connect GA4, Google Ads, Search Console, Facebook Ads, PostgreSQL, MongoDB, SQL Server, Metabase, and more for a single source of truth.
- Scheduled delivery to email/Slack. Share recurring dashboards and reports with stakeholders on exact schedules—weekly, monthly, or custom.
- AI anomaly detection (no alerts). Identify outliers and unexpected shifts across your KPIs so you can dig into the “why” fast.
- Collaborate where you work. Share insights and summaries directly in Slack for quick team alignment.

Ready to keep KPIs and metrics truly actionable?
So what are you waiting for, get your marketing team onboard and start measuring KPIs and metrics on the go! Start your free trial instantly, or book a personalized demo to see it in action!
Recommended reading: How to Make Google Sheets Dashboard in 3 Steps [2025]
Recommended reading: Best 16 Free Google Sheets Dashboard Templates [2025]
Recommended reading: KPIs vs. OKRs: What is the Difference and How to Use Both Correctly
