
90% of Americans cite customer service as a prominent factor in deciding whether to do business with a company or not. Amused? So were we!
As of today, customer service is a $350 billion industry. It’s a fair number because retaining customers is better than acquiring new ones.
Thus, brands are pumping in heavy money to enhance their customer service experience.
And undoubtedly, data-driven leaders believe quality customer service has a positive impact on businesses. May it be in terms of repeat purchases, higher conversion rates, or word-of-mouth marketing.
A prolific customer experience can pave the way to the top of the market.
But how can you measure and improve your customer support? - Customer Service KPIs.
In this article, we'll discuss what customer service KPIs are, how big brands like Apple benefit from them, and what metrics the MANG (Microsoft, Apple, Netflix, & Google) measure to provide quality support to customers.
What are KPIs in Customer Service?
Customer service KPIs are a set of quantifiable measurements used by customer service or support teams to gauge the effectiveness of their customer service process and determine the progress towards set benchmarks.
At first, you might think of these KPIs as inferior when compared to other KPIs for profit, costs, revenue, and sales. However, customer service metrics paint a nuanced picture of your business.
Support KPIs tell you how well your business is bonding with customers and how likely customers are to trust your services.
Moreover, for any business, customer satisfaction is directly linked to crucial metrics such as retention rate, net promoter score, total sales, and many more. Hence, these KPIs play a significant role in shaping your customer relation strategies.
Let's better understand how customer service metrics are essential to your business goals.
Why Should A Business Track Customer Service KPIs?
As the wise man once said, "It takes years to build a reputation, but just a moment to ruin it."
Take Apple, for example. This legacy company holds its spot on the Forbes wall of fame for the 100 most customer-centric companies. Do you know why?
Apple belongs to a posh class of the customer-electronic industry. Meaning it sticks to its customers’ mindset and provides seamless customer service for its product and services.
Technically speaking, Apple employees use the Three F's: Feel, Felt, and Found to empathize and help customers get the perfect tech solutions for their lives.
This leaves the company with a 13% customer loyalty score (the % of customers that want to stick to the brand).
Although the number doesn't sound impressive, it's the highest in the smartphone industry compared to the likes of Google (-36%), Samsung (10%), and Motorola (12%).
So, now we see why companies are reshaping their customer experience. Especially the boom in online shopping, which leaves you in a bloody-competitive market where retaining customers is the key to long-term success.
To do so, tracking customer service KPIs can convey a lot about your customer experiences and your customer support management efforts.
Here's a list of 14 amazing customer service metrics that you should track.
What are the 14 Most Important KPIs In Customer Service to Track?
KPI #1. Number of Support Tickets
Starting with the most tracked KPI by any customer service manager or team - customer support tickets.
This KPI measures the number of support tickets or queries generated by customers over a given period.
Generally, the KPI is measured on a weekly or monthly basis to measure and improve performance instantly.
Why Is It Important?
The number of support tickets tells a lot about your product. The higher the tickets, the more issues customers encounter while using your product. Thus, the lower, the better.
You can even use the title of tickets to figure out what functionality or issues customers encounter the most. Once you know about the most problematic feature, build a solution, and educate your customers.
Measuring this KPI weekly or monthly is essential because any technical issues or bugs faced by customers can be instantly notified to your technical team in the early stages and resolved over time.
Here's a simple formula to calculate the number of support tickets.

KPI #2. Number of Resolved Tickets or Ticket Resolution Rate
This KPI measures the number of tickets that were resolved from the total number of tickets generated over a given period.
Why Is It Important?
How quickly the agents can resolve tickets depicts your team's overall efficiency.
Generally measured as ticket resolution rate, customer service managers often measure it to gauge executives' efficiency and knowledge base.
Here's how you can measure it:

The higher the percentage, the better your executives are performing and the more customers they can help.
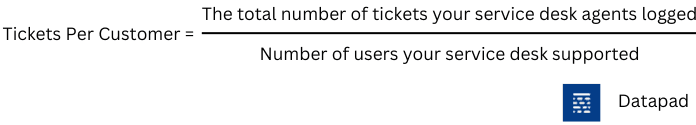
KPI #3. Tickets Per Customer
Ticket per customer is a more granular metric that lets you understand how often an individual customer is facing issues while using your product or service.
Why Is It Important?
Suppose the number of tickets raised by an individual customer is repeatedly rising; they are having a hard time using your product. This can severely impact your product's goodwill and lead to a poor customer experience.
Likewise, if you see a rise in support tickets for every other customer, it's an alarming sign before customers stop using your product. To keep this metric under control, ensure three things:
-
Past customer queries are worked upon to avoid repetitive tickets
-
Support reps ensure that maximum questions can be answered under one ticket
-
Ample amount of helpful resources like blogs, video guides, and tutorials are available for customers to see and learn from
You can use this straightforward formula to calculate ticket per customer:
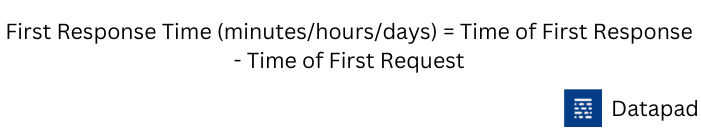
KPI#4. First Response Time [FRT]
The first response time is the measurement of time between the support ticket of a customer and the initial response by an agent. The ticket and response can be from any channel, such as email, chat, or call.
Why Is It Important?
People being highly impatient, tend to freak out if not attended to. Similarly, slow responses can set your customers off. Hence, customer service managers are keen on tracking this metric.
Over 71% of customers believe that a quick response from the service team can significantly improve their buying experience.
Besides, measuring this KPI can do wonders:
-
It lets the customers know that their issues are being looked into as a priority
-
It indicates the promptness of your team's issue addressing ability
-
It helps you better understand your team's capabilities and resources to handle the workload
Here's a simple formula to calculate FRT:
Pro Tip: Deploy an AI-driven chatbot to decrease first response time. The chatbox can easily take forward initial conversations with the customer, allowing agents the time to address a query.
KPI #5. Number of Tickets By Channel
Customers can reach for support from any channel they like - email, website, call, or live chat.
This metric helps customer management executives determine which channels or medium generates higher or lower support tickets.
Why Is It Important?
Tracking the source of customer queries allows you to optimize staffing and prioritize channels that can benefit via automation.
Suppose you receive 100 support tickets per month. Out of 100, 50 are from live chat, 30 are from emails, and 20 are via social media channels.
This breakdown helps you understand which customer support channels are trafficked and demand more staffing or automation to improve response time.
Pro Tip: By tracking the number of tickets per medium, you prioritize and shift resources to where your customers are.
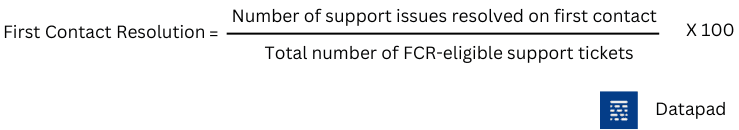
KPI #6. First Contact Resolution Rate [FCR]
Do you know what customers really love? They feel hap[y when you resolve their queries at first contact.
The First Contact Resolution Rate (FCR) refers to the percentage of tickets that are resolved in the first connection itself.
Why Is It Important?
Making your customer jump calls or come again and again for the same issue can lead to a pathetic experience.
A study by the Ascent group reveals that measuring FCR for 1+ years reports a 1-30% improvement in customer service quality.
Moreover, this metric helps you gauge your customer satisfaction rate. The higher the FCR, the more satisfied your customers are. You also get to know how well your agents know your product and how efficiently they resolve problems with their knowledge.
Here's how you can measure FCR:
KPI #7. Average Resolution Time [ART]
Average Resolution Time or ART measures the amount of time taken by agents to resolve an ongoing ticket or query. Like first contact resolution, this metric also impacts your customer satisfaction score.
Why Is It Important?
Resolution time is an important metric for service industries where tickets escalate or move to other departments. Generally, the length of time depends on the complexity of the problem; however, the quicker, the better.
If you measure the metric per-employee basis, you can figure out which executive is taking longer to resolve tickets and which are your quick problem solvers.
We analyzed over 6000+ eCommerce stores and found that the average resolution time of the top-performing companies is 1.67 hrs.
Want to calculate your resolution time? Here's how you can do it.

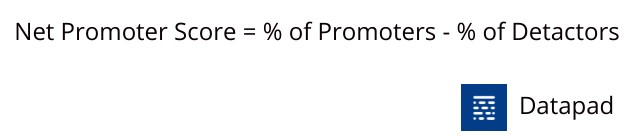
KPI #8. Net Promoter Score [NPS]
Net Promoter Score measures the likelihood of a customer recommending your product or service to their friends or contacts.
Why Is It Important?
Net promoter score is a widely used metric that analyzes the customer's relationship with the brand. It's measured on a scale from 0 to 10, where zero is the worst experience, and 10 is the sought-after experience of customers.
Or, you can simply categorize the responses into three categories:
-
Detractors (0-6): The unsatisfied customers who won’t be using or recommending your brand
-
Passives (7-8): Group of satisfied customers who are also vulnerable to competitors
-
Promoters (9-10): The loyal and happy customers who will stick to your brand and recommend it to friends and contacts
In this context, you can simply share feedback or survey forms with customers after their query is resolved to understand their views on your support quality.
KPI #9. Abandon Conversation Rate
Abandon Conversation Rate refers to the number of users that hang up the call before connecting to or getting a resolution from a customer service executive.
Why Is It Important?
Abandon calls are typically due to long waiting queues or poor communication from the agents. Whether the conversation is via email, chat, or phone call, conversation abandonment signals something more significant is wrong.
Therefore, this metric helps managers understand and analyze what's setting off customers. Understanding and improving the pain points can immensely help you enhance your service experience.
To calculate the abandon conversation rate, you need to track the number of abandon incidents from emails, calls, or live chats. Once you have this data, use the below-given formula:

KPI #10. Customer Retention Rate
This key performance indicator measures the rate at which your existing customers use your services or purchase products on a recurring basis.
Why Is It Important?
Retention rate is an important metric to track because 80% of your future revenue will come from 20% of your existing customers. Plus, a lost customer costs you $243 on average.
And since customer acquisition costs are rising every passing day, retaining existing customers sounds more economically promising for businesses.
Apart from the factful reasons mentioned above, customer service has a keen role in retaining customers.
You can work with your customer service reps to draw retention strategies for customers on the brink of exiting. Thereby following up with them via cold calls, offers, troubleshooting, and more.
Here's the best way to evaluate customer retention rate:

Where,
-
CE indicates the number of customers at the end of the process
-
CN refers to the number of new customers acquired during the process, and
-
CS stands for the number of customers at the beginning of the process
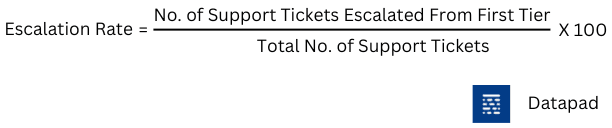
KPI #11.Escalation Rate
Escalation rate refers to the number of support tickets that were transferred to another person with more experience and knowledge. This person is generally the customer service manager or an individual with authority.
Why Is It Important?
A higher escalation rate implies three things:
-
The lower-level executives are finding it challenging to deal with the problem
-
The executive doesn't have adequate authority to resolve the problem on own
-
Customers are unhappy with the executive's response, thus, want an experienced person on call
Therefore, tracking this metric can help you better understand the issue causing higher escalations.
If it's regarding a lack of authority to executives to provide solutions, you need to reshape your role-based management strategies.
But if it's due to the executive's inability to converse, you can set up training and webinars to enhance their skills.
Here's how you can calculate the escalation rate:
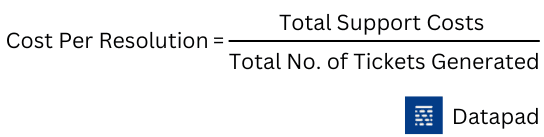
KPI #12. Cost Per Resolution
Cost Per Resolution refers to the cost associated with resolving a ticket. It includes the cost of calls, operating expenses, training costs, staffing remunerations, and more.
Why Is It Important?
48% of customers feel that their customer service expectations have increased over the last few years.
Now since the expectations are high, the resolutions will be costlier. You would need more professional and trained employees to cope with customer expectations. Hence, cost per resolution is a non-ignorable metric.
Moreover, you can figure out what portion of your revenue is being put-in into your customer service department. With these insights, you can work on strategies to provide quality services at minimal costs.
The calculation of cost per resolution is pretty simple.
KPI #13. Average Conversion Rate
The average conversion rate refers to the number of customers who completed a specific action after conversing with your support team.
Why Is It Important?
Forrester research found that 44% of customers feel that having their questions answered in the middle of the buying journey fascinated them the most. Thus, leading them to make a purchase.
An interactive pre-sale customer service rep can make all the difference between a sale and a bounce.
And since you’re pumping $$$ into your customer service department, you don't only expect them to resolve customer issues, do you?
Instead, you can train executives to push in deals and extra services to customers when and where possible. But for the most part, your support team should be able to help a customer in a way that leads them to take a desirable action, preferably a purchase.
Here's how you can calculate the average conversion rate:

KPI #14. Tickets Closed Per Agent
Pivoting back to the performance of your inbound team, this KPI measures the number of support tickets closed by individual support staff over a given period.
Why Is It Important?
The tickets closed per agent metric is used explicitly for measuring employees' performance. Being a customer service executive, the number of closed tickets accounts for your efficiency and productivity at work.
Moreover, tracking this metric lets you identify your department's best and worst-performing employees. Therefore, allowing you to build data-driven hiring, training, or retention strategies.
You can just look at your sales CRM to know the number of tickets closed for individual support agents or count it manually.
How to Track Customer Service KPIs with Datapad?
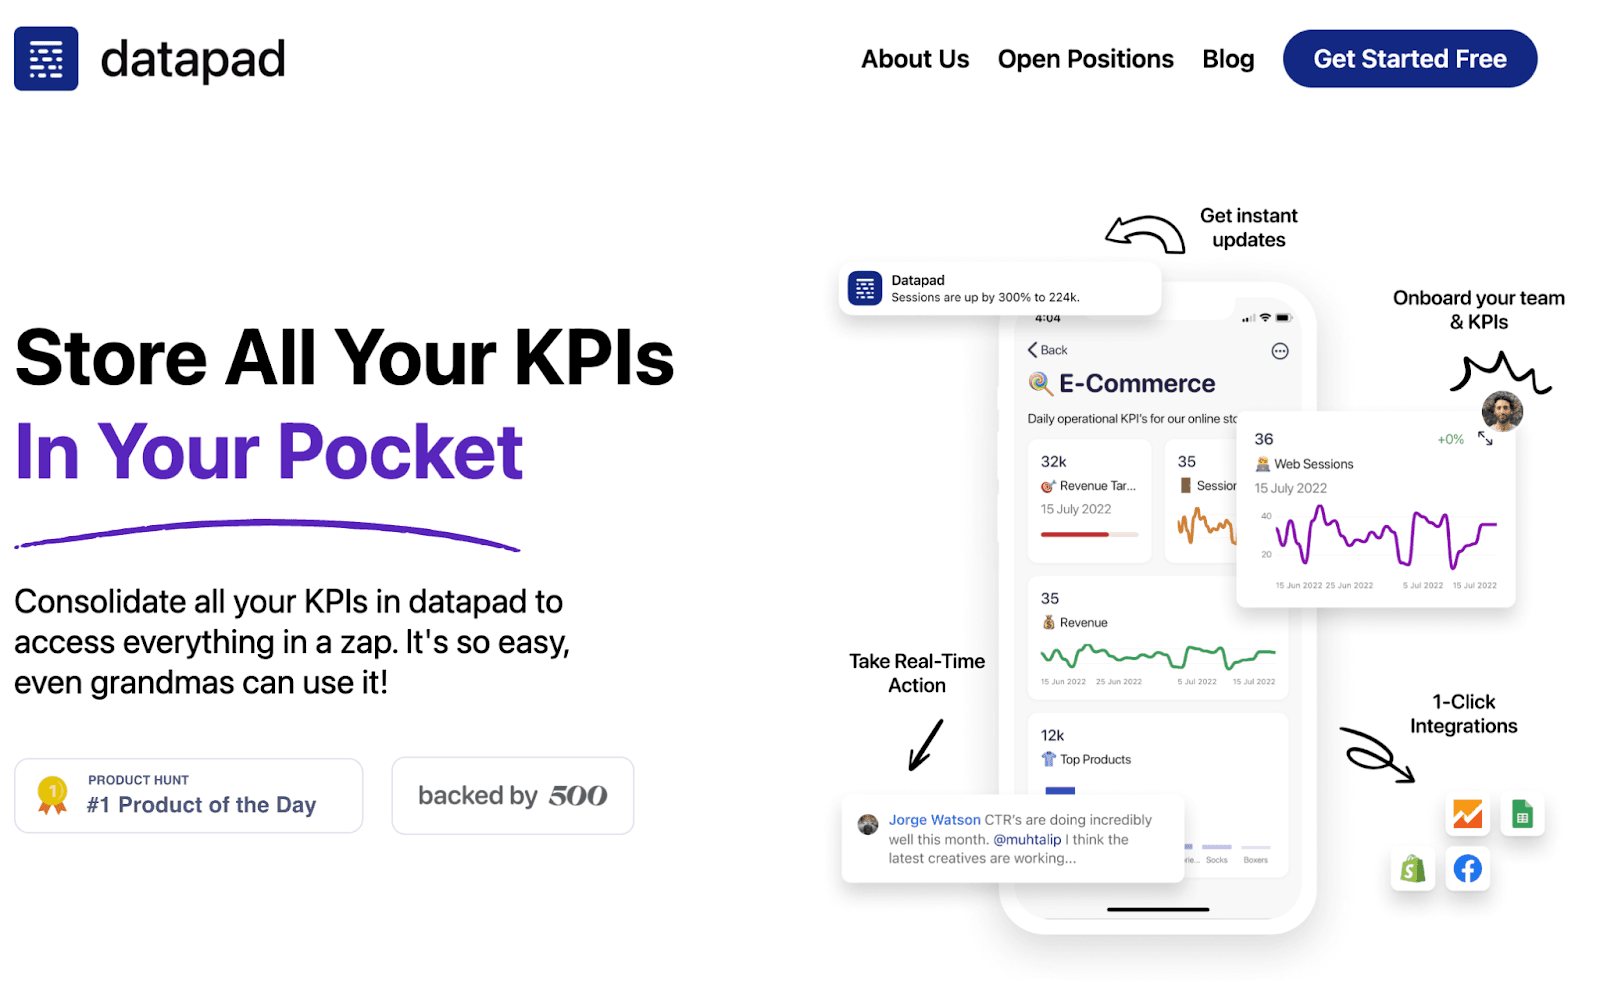
Datapad is a mobile-friendly KPI tracking software that allows small to medium size business owners to collect, measure, and analyze critical business metrics from their mobile phones.
Its mobile-first interface helps you perform every function on your mobile that a typical desktop dashboarding software does - from data extraction to monitoring and customizations, you have it all under your fingertips.
Here's how you can track customer support KPIs in Datapad in three easy steps.
Step 1: Create a Dashboard
To begin with, download our app on your mobile (available for both Android and iOS) and sign up with your email address.
Now open the app, and press the '+' sign on the top right corner.
Here, you need to fill in a name and a few other details to personalize your dashboarding experience. Then click on Create.
That's it! Your dashboard has been created automatically.
Step 2: Bring Your Customer Service Team On Board
A single executive can't support every customer. That's why the onboarding process in Datapad is easier than ever.
It just takes a few minutes to bring your executives on board. You can send email invites to all your staff without leaving the app. And then, you can relax and let them handle their duties!
Meanwhile, you're always welcome to supervise your employees' activities and actions from an admin viewpoint.

Step 3: Import Data from Multiple Data Sources
Once your customer support team is ready, it's time to flow some data into your dashboard.
With Datapad, you can import data both ways - automatically and manually.
Here’s how you can import data with our one-click integrations👇🏻

And if you have a comparatively smaller dataset, here's how you can import data manually with Datapad:

Once you have everything in place, you can easily change the look and feel of your dashboard with our intuitive drag-and-drop editor and tons of pre-built data visualization elements and widgets.
With Datapad, creating your customer service dashboard isn't just easy but also a cost-effective solution.
Want to try Datapad for free? Join us today!