![11 Best DashThis Alternatives for 2024 [Tested & Ranked ]](/_next/image?url=https%3A%2F%2Fframerusercontent.com%2Fimages%2FKRDAa8Hsk2HPRAallFKHNiLtU.png&w=3840&q=75)
We tested best DashThis alternatives for tracking KPIs and creating stunning dashboards.
In this article, we will list and discuss those software, and you will see exactly why they are better than DashThis to help you take your business to the next level.
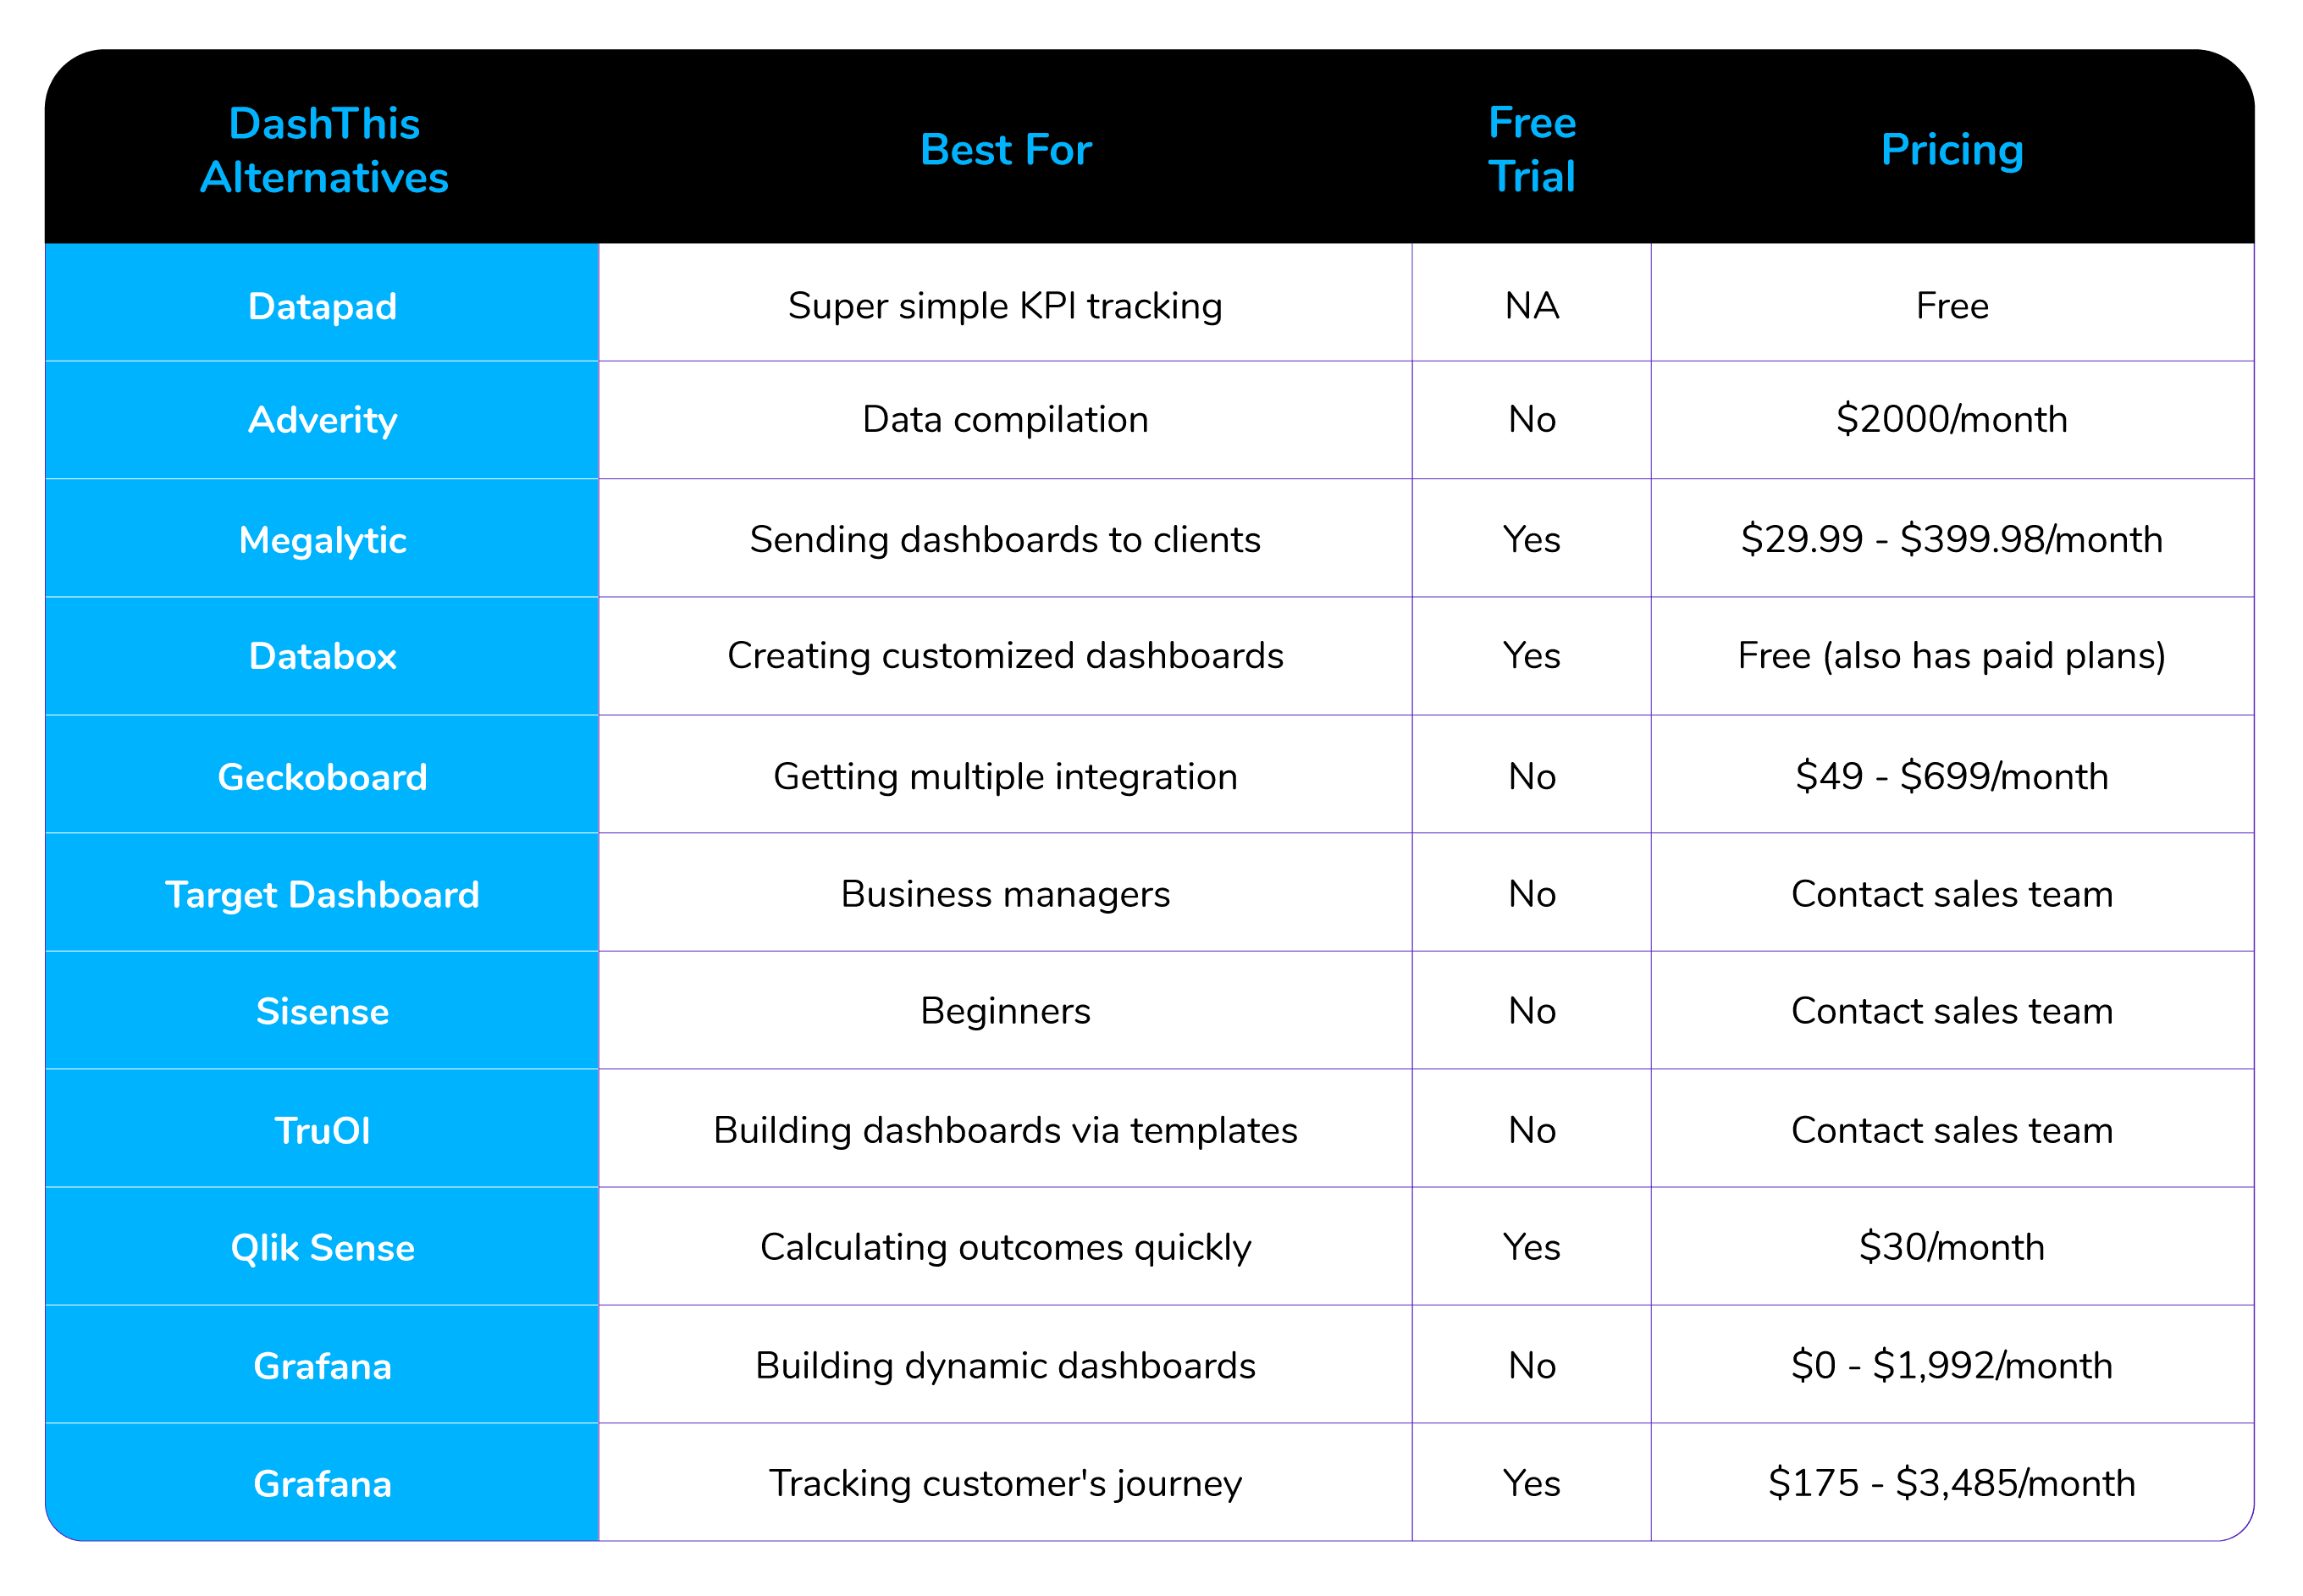
Why You Might Need a DashThis Alternative? Datapad Adverity Megalytic Databox Geckoboard Target Dashboard Sisense TruOl Qlik Grafana Segmetrics
We will get into the nitty-gritty details of these software in some time. But first, let's understand - why you might need a DashThis alternative in the first place?
Why You Might Need a DashThis Alternative?
Reason #1. Poor User Interface
When tracking KPIs for your business, having an excellent CX will keep you interested and ease your work.
If a dashboard is poorly designed, has a shabby layout, and lacks finesse, tracking and analyzing data can be a nightmare for you.
Did you know that almost 90% of users don't use the software or revisit a site that has a poor user interface? This is a major concern, and DashThis has failed to act on it.
DashThis is a decade-old company but has failed to bring forth a modernized product that business owners love.
Look at the ‘Cons’ section here:

This is just the tip of the iceberg; if you skim through DashThis's review on Capterra, G2, and other such sites, you will find many people complaining about visualization.
Reason #2. Limited Customization Options
Let's face it; when you invest in a product (especially in dashboard software), the first thing you see is if you can customize the platform according to your business needs. This is non-negotiable for many managers and company owners.
Customization and personalization go hand in hand, and people love it. So much so that 80% of customers are more likely to buy from a brand that gives them a tailored experience.
DashThis has customization features, but they're basic. Apart from this, the platform also lacks some automation features.
For example, you can’t get automated alerts on your emails when a KPI you’re tracking falls or rises out of your set benchmark. Everyone expects this basic automation when they pay for a tool monthly, right?
Reason #3. Steep Learning Curve
Most business owners and managers don't want a tool that's too complex for them to understand, let alone use on a daily basis.
Here's the catch, to use DashThis, you first have to sit and learn its intricacies, which means spending hours sorting things out.
Good luck with that :)
And then, when you've finally mastered it, it might be too late for a specific KPI to track.
Now that you know why you must consider a DashThis alternative, it's time to see your potential options.
What Are The Best DashThis Alternatives?
#1. Datapad

Datapad helps you track all essential metrics from stunning dashboards.
The beauty of Datapad lies in its simplicity and ease of use. With our tool, anyone in your team with zero technical knowledge can start building reports in mere seconds.
As a go-to solution for Agencies, Datapad makes it easy to onboard new customers with 1-click templates and share performance reports with read-only links.
Datapad also makes it easy to collaborate as a team with the ability to drop comments on KPI cards.
The AI insights tool lets anyone detect anomalies in their data and provides actionable to-do items to increase performance.
Key Feature #1. Templates

Creating reports for your business is no easy task. You have to determine a lot, from which metrics to choose to design the right charts.
If you are an agency and want to create the same reports for multiple clients, then this hassle becomes even more burdensome.
Guess what? Datapad lets you do all this with just a few clicks.
With Datapad's templating features, you can:
-
Choose from a gallery of pre-designed templates and apply them with 1-click
-
Build a custom dashboard and re-use it as a template by changing it's sources
-
Share all connected data sources in the workspace with your teammates
Key Feature #2. Team Collaboration

Tracking KPIs isn't a one-person job when you have a lot of them; you need a team. But not all KPI dashboard tools let you bring your team on board.
Guess what? Datapad lets you do it quickly and easily.
Moreover, you can assign individual team members tasks to handle, goals to achieve, and metrics to measure.
With Datapad's team collaboration feature, you can:
-
Get notified whenever there’s an update for any metrics and KPIs you track
-
Communicate around your metrics and KPIs with your team members
-
Get push notifications on your phone to stay updated with all your KPIs
Key Feature #3. Automated Reports & Scorecards
Wouldn't it be great if you could check your business KPIs first thing in the morning, straight from your inbox?
With our dashboard software, you can subscribe to any dashboard and receive daily email updates.
All you have to do is build a dashboard, click the subscribe button, and set your email preferences.
The best part is you can share reports with anyone, even emails outside of your organization or workspace.
Step 1: Subscribe to a dashboard

Step 2: Check your inbox

With Datapad’s report and scorecard automation, you can:
-
Subscribe to any dashboard
-
Receive daily highlights around all KPIs
-
Send reports to users in and outside of your organization
-
Customize the date range, calculation, and styling of KPIs
Pricing
Datapad has a free tier that includes 1 dashboard. If you want more, you can upgrade to the $30 Standard Plan, which includes 3 dashboards and scales with your usage. Datapad also offers a Business Plan tailored for agencies and includes dedicated customer support.
We are now offering an earlybird discount to all users, so it's a great time to sign up and give Datapad a spin.
#2. Adverity

Adverity is a data visualization and reporting tool that lets you track KPIs from multiple sources in a single dashboard.
Features
-
The platform lets you monitor performance, demonstrate value, and democratize data quickly and easily
-
Adverity’s predictive analytics helps you connect your KPI dashboard with the software and discover hidden trends and opportunities; these opportunities will help you optimize your strategies and increase ROI over time
-
The platform comes with pre-built templates (out-of-the-box dashboards) that you can customize in just a few clicks and get on with tracking
-
Also has a drag-and-drop builder that lets you create a dashboard from scratch
Pricing
Adverity gives you two paid options: Premium (Starting from $2000) and Enterprise (contact their sales team). The exact pricing will depend on several factors such as data volume, chosen connectors, data destinations, and user access.

#3. Megalytic
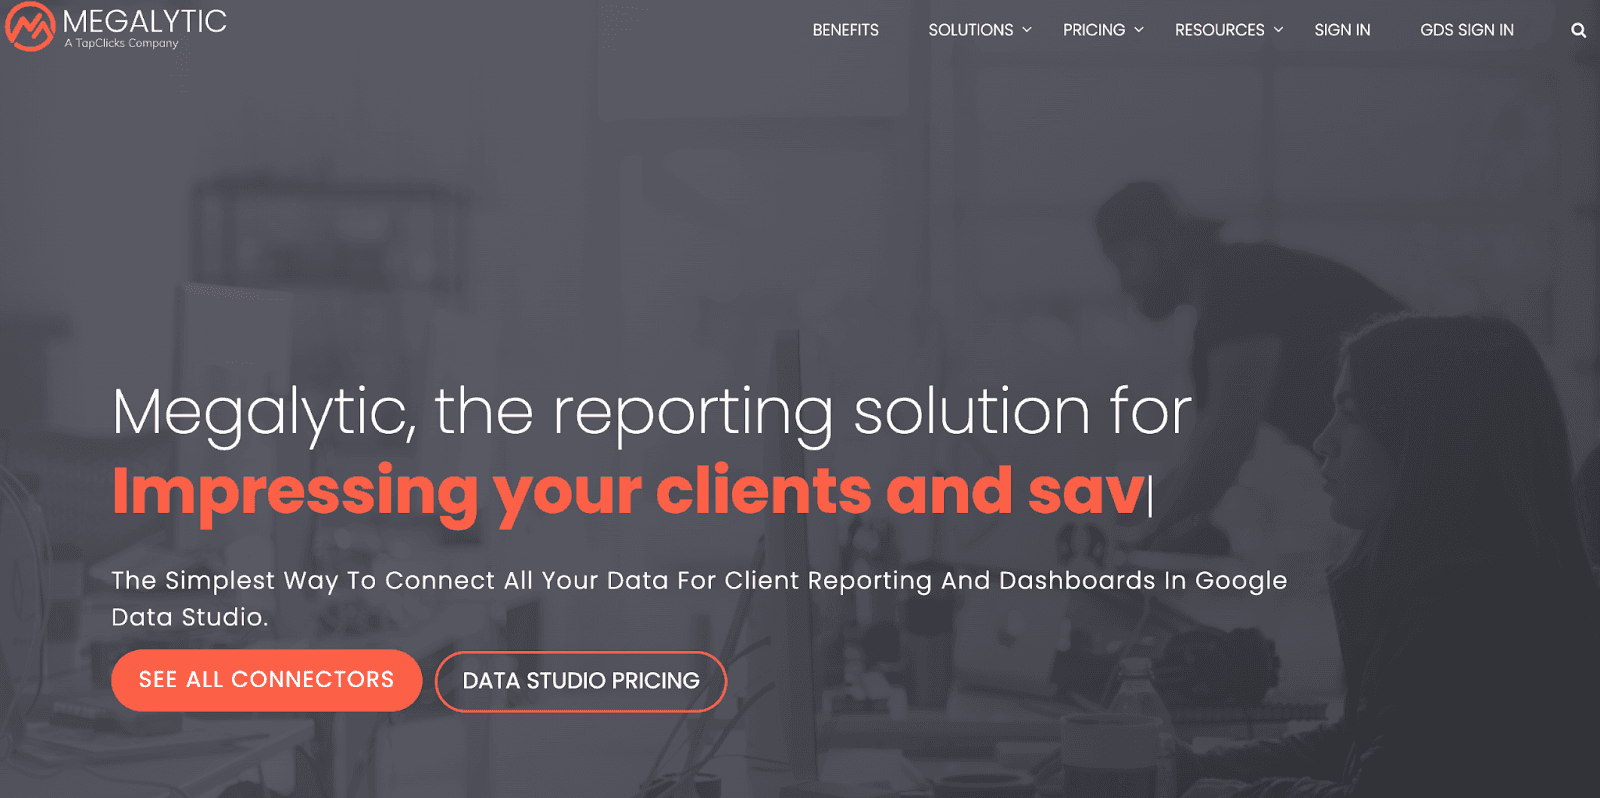
Megalytics is a business intelligence and client reporting platform that businesses use to create and send white label reports to clients.
The platform is beneficial for three use cases:
-
If you want to track PPC campaign-related metrics
-
You’re running a digital marketing agency
-
You’re a vertical market specialist
Let’s see how you can use the tool correctly for each of the above use cases.
Features
-
The tool gives you 10+ Google Data Studio connectors like Facebook ads, LinkedIn ads, Google Analytics, and many more so that you can import all your data to Megalytic.
-
Digital marketing agencies or freelancers can leverage Megalytic to generate SEO, PPC, and email marketing reports to send to their clients.
-
Are you a vertical market specialist? If yes, the tool can help you track KPIs in your respective sector. From automobiles to dental KPIs, Megalytic lets you track everything.
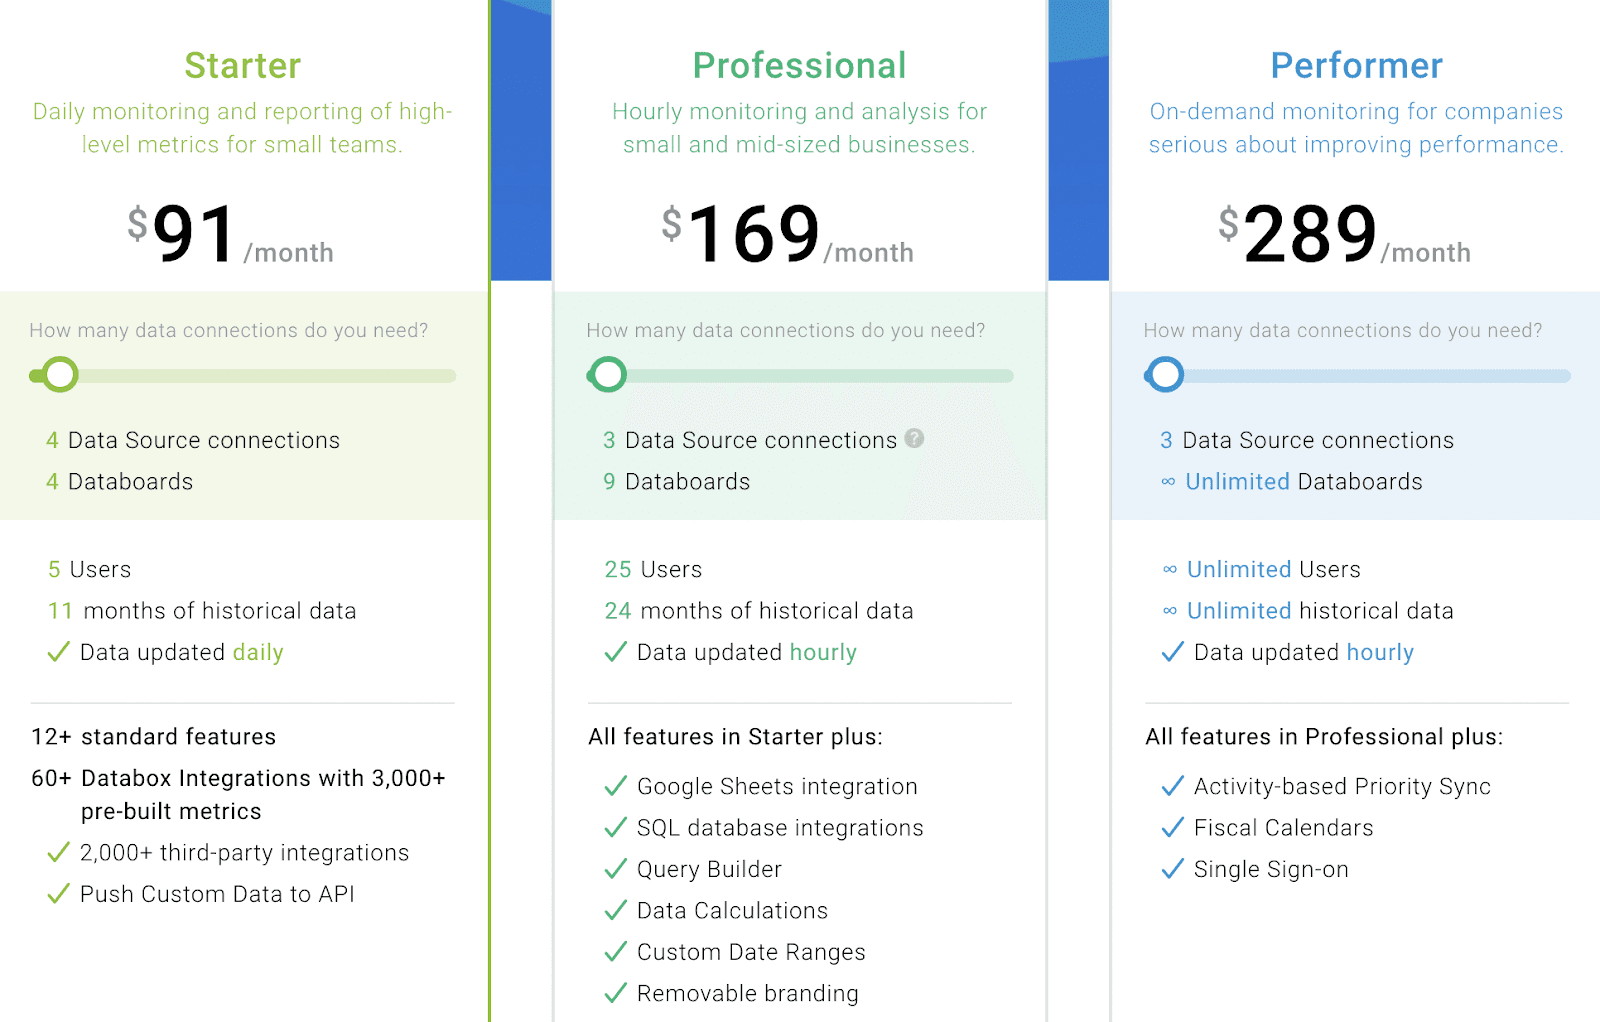
Pricing
Megalytic has two pricing options. If you want to just integrate Google Data Studio to the platform to add connectors, you can pay $29.99/mo/connector for 3 users and 20 accounts.
But if you want to build reports on the software, here are the 4 plans you can choose from.

All the plans mentioned above come with a 14-day free trial.
#4. Databox

Databox solves the problem of logging into multiple accounts to keep track of business performance. It helps you track all the business KPIs with a single account.
Features
-
The platform’s dashboard designer lets you pull out essential metrics, visualize them in a user-friendly way, and create customized dashboards in real-time
-
Share your dashboard on your TV screen to visualize them better and set goals and keep track of them
-
Get automated alerts when there's a significant change (positive or negative) for all your essential metrics
-
Get daily, weekly, or monthly performance reports via email, Slack, and many other platforms
-
The tool has hundreds of integrations that can help you import data, track it correctly, and drill down on data in-depth
Pricing
Databox has a free-forever plan wherein you get 3 data source connections, standard features, and more than 60 integrations. Apart from this, the platform has three paid plans.
Check out this article for detailed review of pricing plans of Databox
#5. Geckoboard
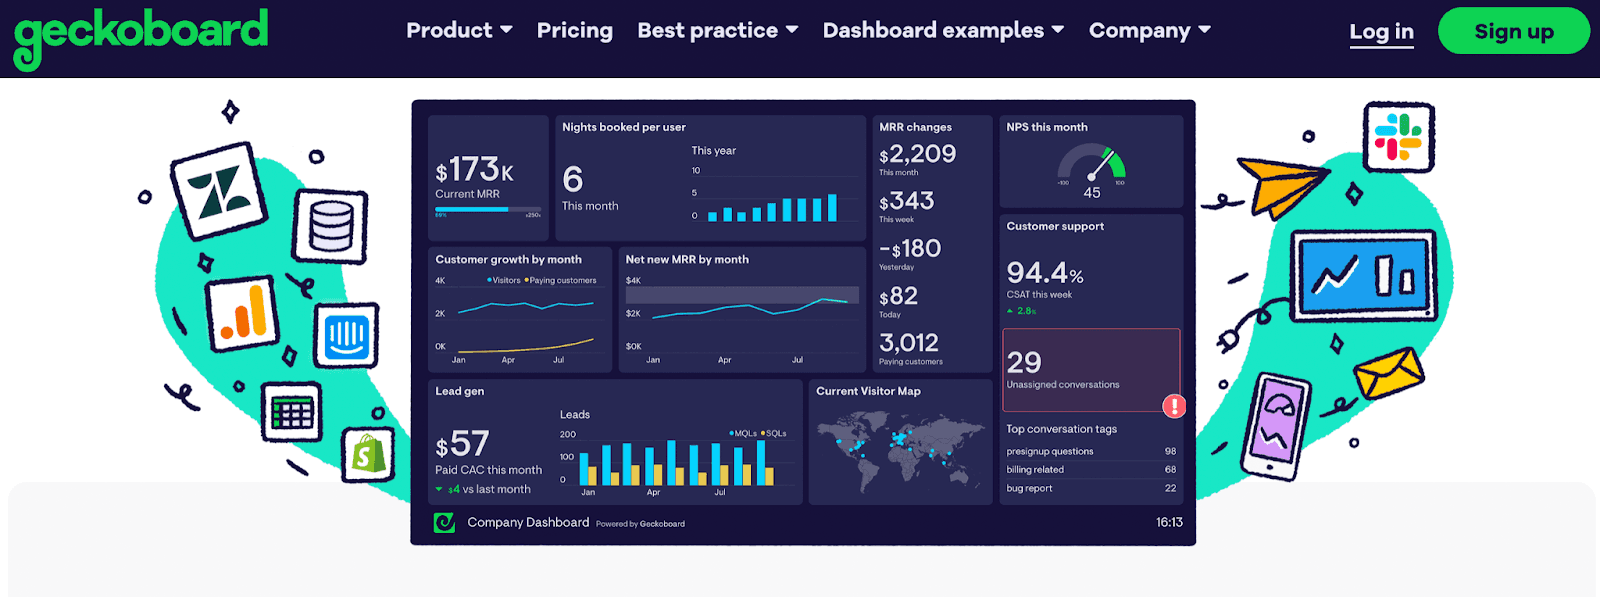
Like Databox, Geckoboard is a dashboard software that lets you track KPIs hassle-free. The platform offers 80+ data sources that you can integrate your account to without coding.
Features
-
Geckoboard integrates with Slack - a go-to business tool for many businesses
-
Schedule daily dashboard snapshots for a particular channel and discuss all the KPIs with your team member
-
Pair your TV with your Geckoboard account - all you need for this is a big screen, a way to display a web browser on TV, and a Geckoboard account
Pricing
Geckoboard has three plans to choose from:

Note: Compared to other DashThis alternatives, Geckoboard is expensive. If you want to try it, they do offer to test the platform out for free, that's limited to 1 dashboard creation via spreadsheet. But if you're not happy with it, you can look at the nine Geckoboard alternatives we've tested this year.
#6. Target Dashboard
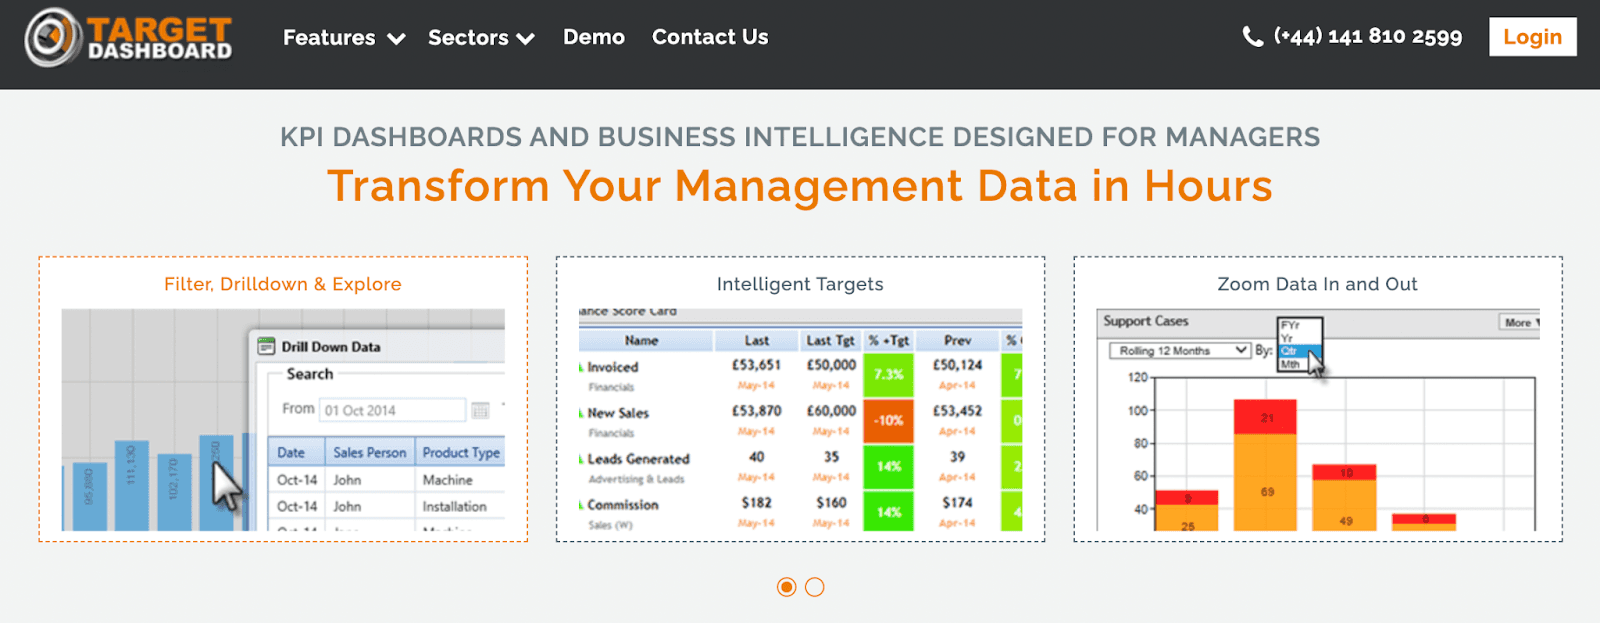
Target Dashboard is a tool designed for managers to track KPIs via smart, simple yet effective dashboards.
Features
-
Connect Target dashboard to your system, Excel, or share it instantly with your team or on social media
-
The platform comes with 300+ layouts you can customize to build a dashboard quickly
-
When it comes to displaying methods, Target Dashboard uses the most effective industry-leading methods, some of them being charts and graphs, year-over-year comparison chart, and heat maps
-
Automatically do calculations like upscaling data as per your frequency choice to make your life easy
-
Sends automatic alerts and warnings to your email if a KPI dips or rises
Pricing
Target dashboard doesn't disclose its pricing on the official website. You can contact their customer support team to set up a free trial or book a demo first.
#7. Sisense
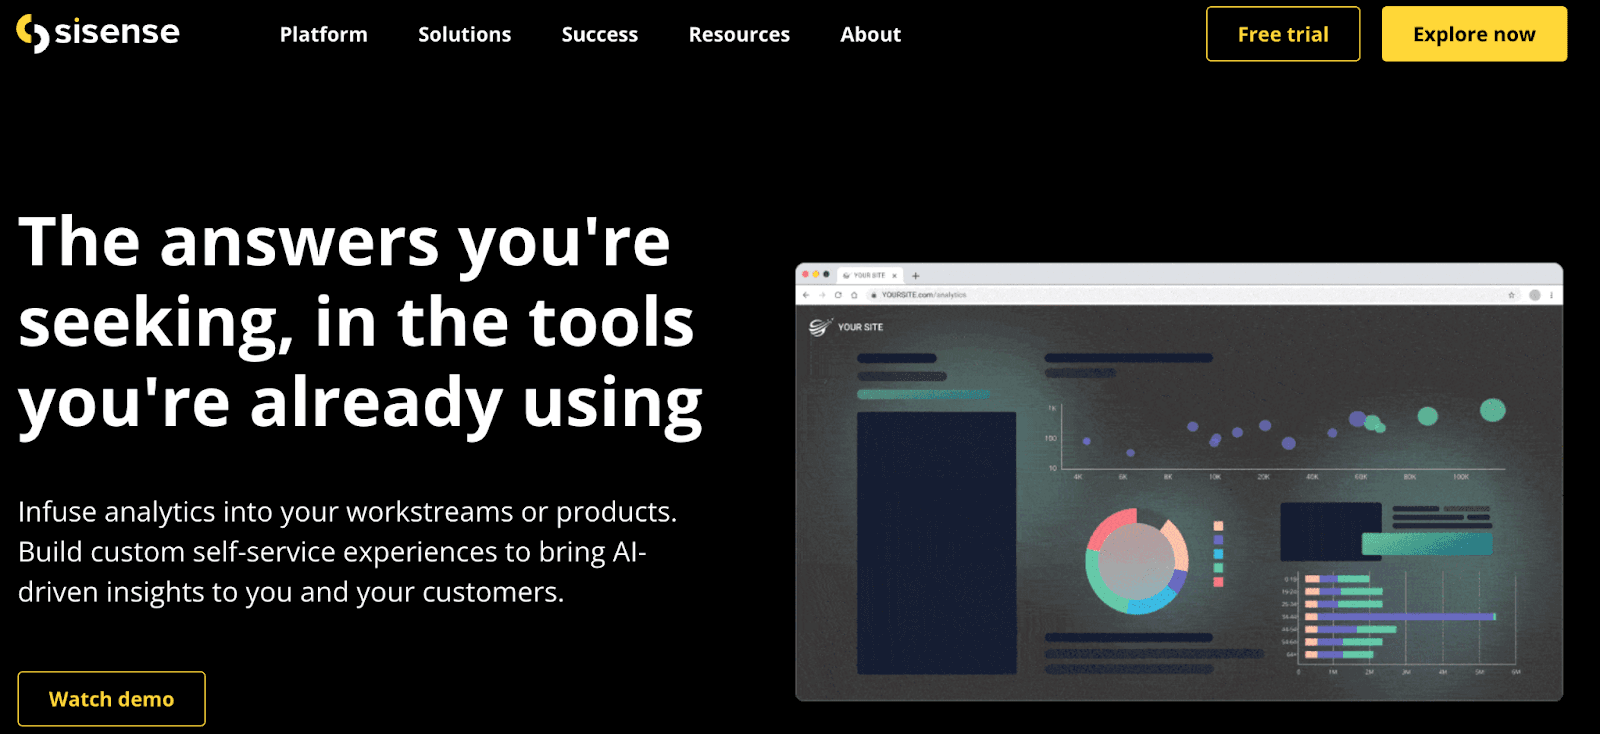
Sisense helps you infuse web analytics into your workspace or product to make tracking and analysis easy for you. The tool can be beneficial for marketing channels and project management.
Features
-
Track every metric, embed a dashboard to your communication channels (like Slack), leverage widgets, and filter our valuable KPI data
-
Comes with a drag-and-drop dashboard maker that aids you in making dashboards from scratch, exploring your options, and delivering insights
-
Sisense’s Intelligence Data Visualization tool converts complex and huge data sheets into easy and digestible graphs
-
You can also leverage the tool’s pre-built templates to create highly customizable visualizations with just a few clicks
-
Sisense also has an SDK that acts as an API with which you can create an app-like experience for your dashboards
-
Share reports via email, links, or even send out reports automatically every week
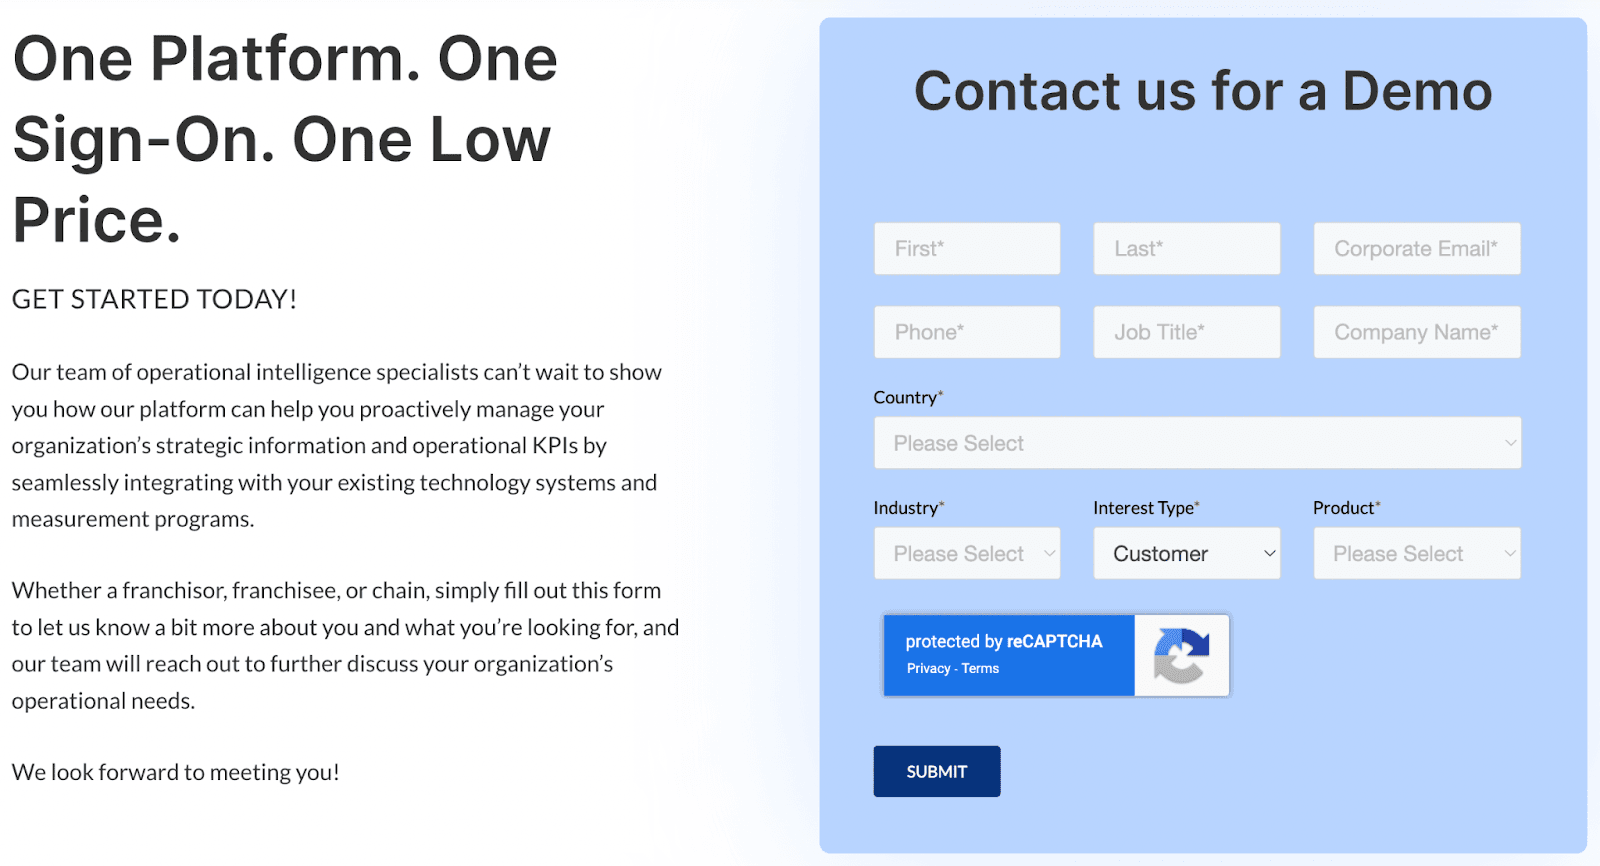
Pricing
Like Target Dashboard, Sisense also doesn’t reveal its pricing. You can fill up a form, request a free trial, and talk to their sales team for pricing.

#8. TruOI

TruOI is an iDashboard KPI tracking tool that integrates enterprise-wide data and compiles them in a single dashboard for you to view it easily. The main motive of the platform is to show you how your company’s performing in the long run.
Features
-
You can access TruOI’s iDashboards from any device - computer, mobile, or wall displays
-
The tool also offers a one-on-one client success program wherein they guide you on how to transform your dashboard into a money-making asset
-
Create these dashboards via TruOI’s builder tile and templates or use its drag and drop functionality to create one from scratch
-
Embed the dashboard on your website to show your achievements to the target audience
Pricing
You need to request a demo by filling out a form, and then if you like what you see, you can ask for the pricing according to your business requirements.
#9. Qlik Sense
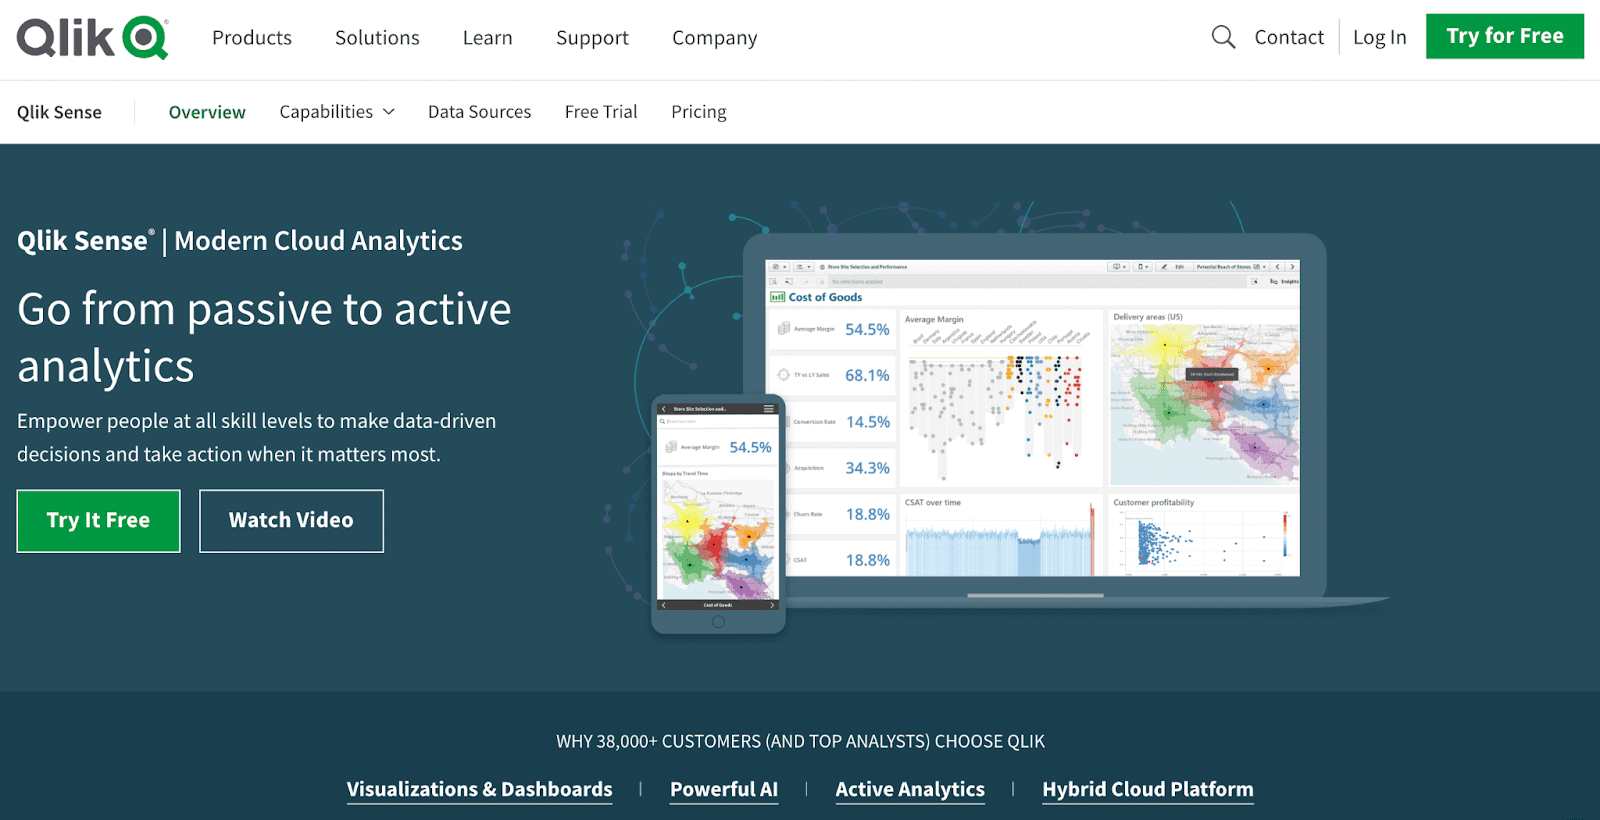
Qlik Sense is a cloud analytics platform that lets you create dashboards and calculate outcomes at hyperfast speed.
Features
-
Its self-service visualization feature of Qlik Sense lets you combine, load, visualize, and explore data, no matter how big or small
-
All the charts and graphs the platform offers are interactive, meaning the changes you make in the values will instantly reflect on these charts and graphs you use on your dashboard
-
The interactive dashboard you make with Qlik provides great insights to make a strong data-driven decision
-
With search-based analytics, you can generate the most relevant visualizations and analysis based on natural language processing; this feature can help you get a series of charts that you can edit and add to a fully interactive dashboard and dig deeper
-
Stay on top of your business by using Qlik Sense's alerts and notifications feature that notifies you of all the important changes in your data
-
Access Qlik Sense from your mobile and take action faster
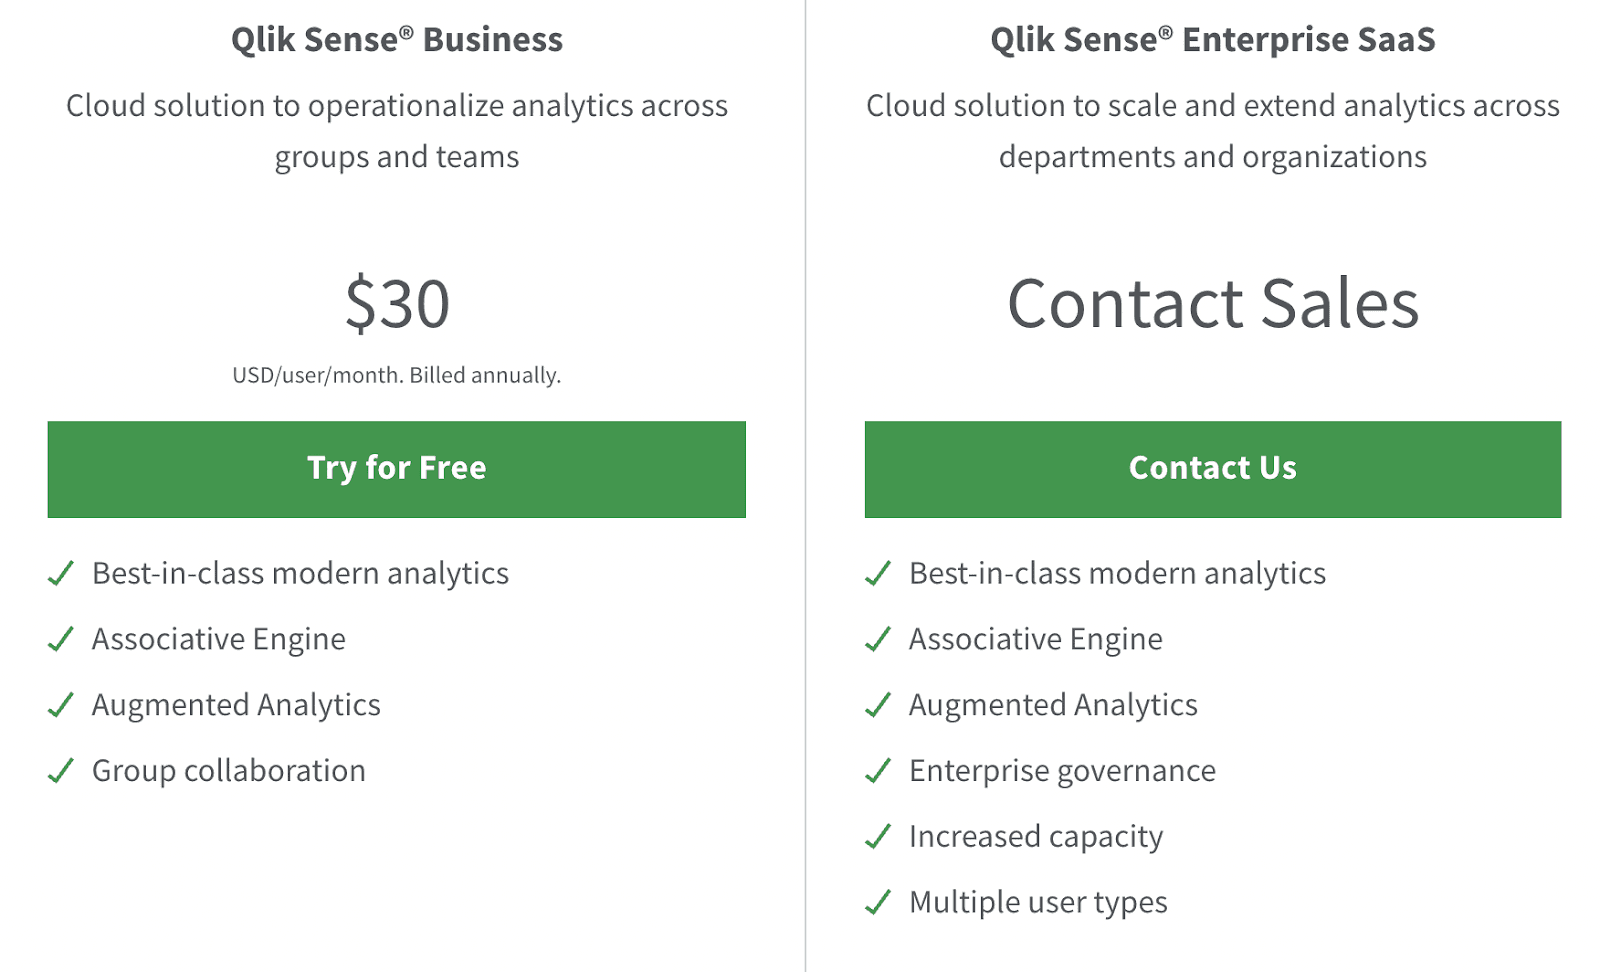
Pricing
You can get started with Qlik Sense by signing up for a Business plan that will cost you $30/mo/user. However, you will be billed annually for it. There are several other plans to choose from, but to get a quote, you will have to contact their sales team.
#10. Grafana

With Grafana, you can pull your data from anywhere, be it from a raspberry pi, Google Sheets, or even any cloud service.
Features
-
The platform lets you share dynamic dashboards with your teammates so that you can discuss future steps accordingly
-
Helps democratize data so that everyone in your team can access it without breaking a sweat and make customized dashboards depending on the KPIs they want to track
-
The tool has a collection of 100+ visualizations that covers everything from a simple bar graph to a complex histogram
-
Has hundreds of plugins that you can install and embed with your dashboards to improve functionality and make your life easier
-
With one simple UI, Grafana lets you set, manage, and silence all alerts as per your convenience
-
The platform also lets you transform non-time-series data into tables in seconds without coding
Pricing
Grafana has four plans to choose from - Free, Pro, Advanced, and Enterprise.

#11. SegMetrics
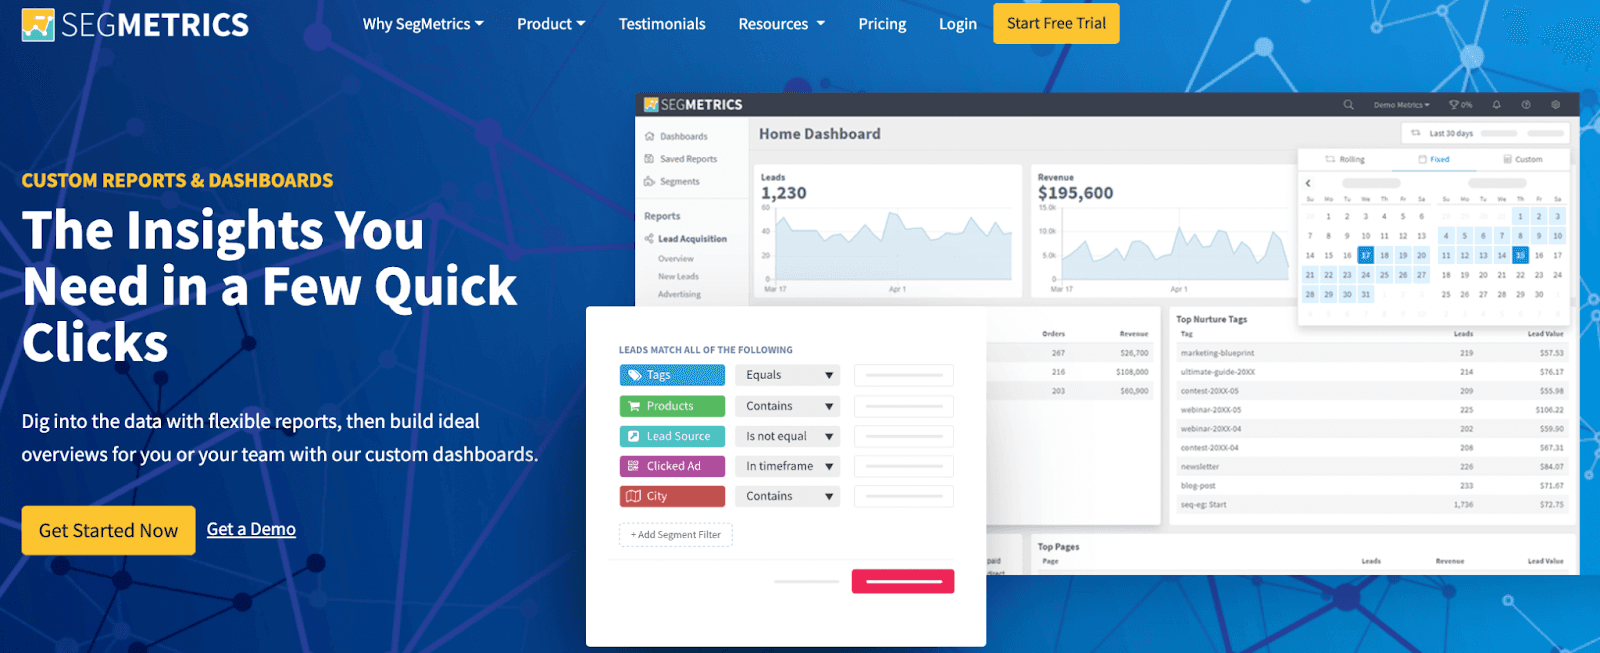
With SegMetrics, you can measure and analyze data on every step of your customer’s journey.
Features
-
From return over investment per customer to ad campaign results, you can create all kinds of dashboards and convert them into reports to share with your team members
-
Leverage custom dashboards to gather all your important graphs, charts, and many more visual assets to discover new KPIs and stay on top of your business
-
Ask the platform advanced questions like: ‘What was my revenue this month from the customer I acquired via my email list?’ And the tool will show you the result you expect
-
The platform also gives you an understanding of specific cohorts that might be most valuable for your business.
Pricing
SegMetrics has three plans to choose from, but every plan has a price range depending on your team size.

No matter which plan you choose, you get a 14-day free trial to kick things off.
Want An Easy-to-Use & Attractive DashThis Alternative?
When it comes to experience, DashThis is a decade-old player; but not everything that's old is gold.
The platform overall needs an upgrade, needs serious work when it comes to customization options, and several user interface improvements.
Lucky for you, good DashThis alternatives aren’t hard to find, with Datapad, you can track KPIs from your phones - easily and quickly.
So sign up by filling out the form, tell us what you like, and give us your valuable feedback, and we will work on it.
If you are looking for more tool reviews, check out our in-depth guide for: