
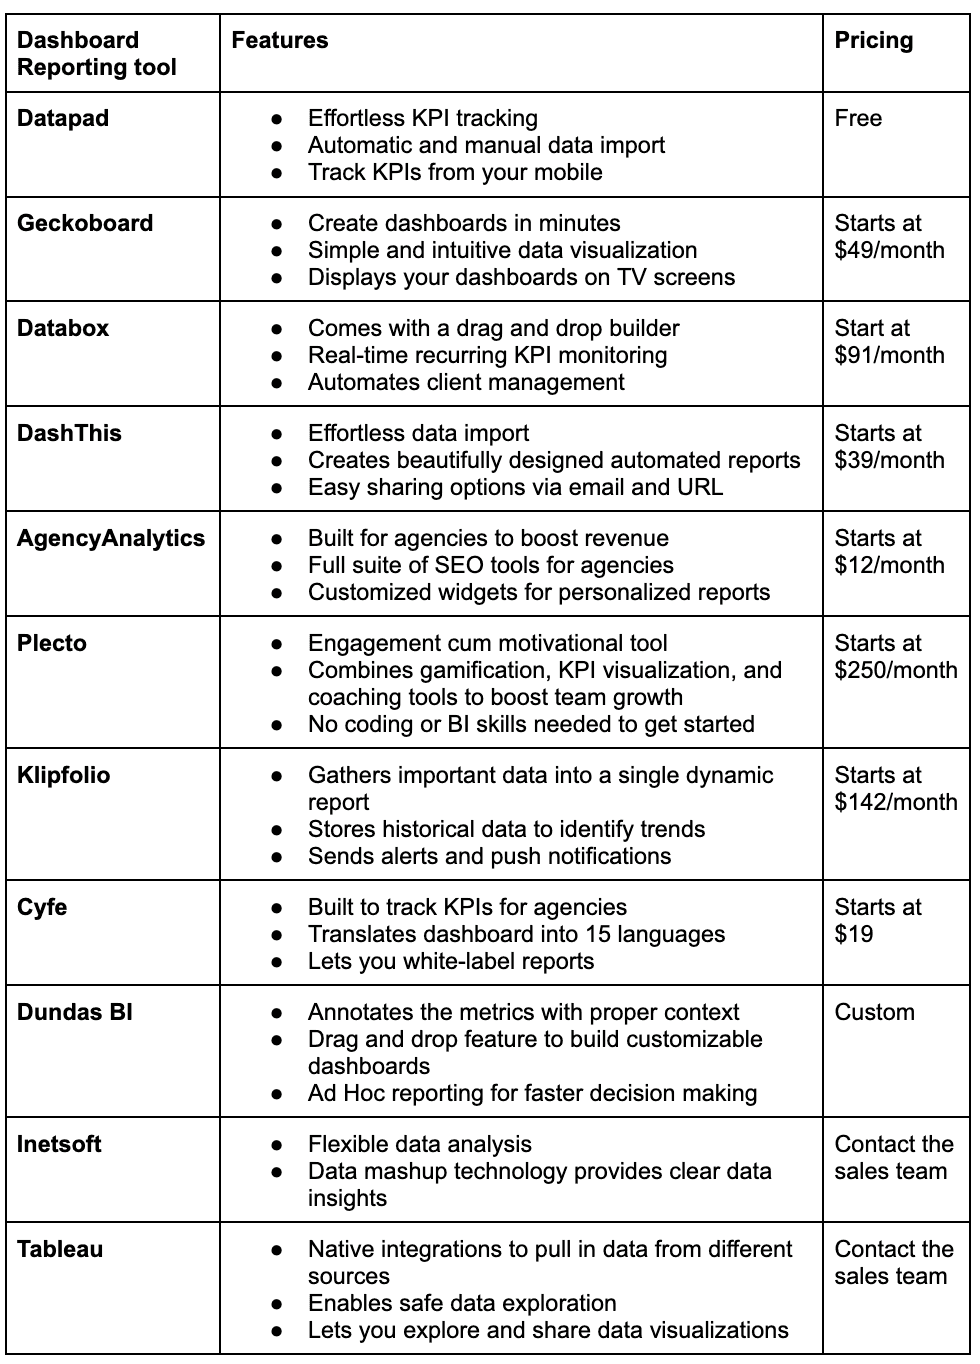
Some of the best operational dashboard tools for staying on top of your business are Datapad, Geckoboard, Databox, DashThis, AgencyAnalytics, Plecto, Klipfolio, Cyfe, Dundas BI, Inetsoft, and Tableau.
In this guide, you will find a detailed review of the above-mentioned operational dashboard tools and get to know which one’s the best for your business.
What is an Operational Dashboard? What to Look for When Choosing an Operational Dashboard Tool? Datapad Geckoboard Databox Dashthis AgencyAnalytics Plecto Klipfolio Cyfe Dundas BI Inetsoft Tableau Wrap Up
Disclaimer: The information below is accurate as of August 22, 2022.
What is an Operational Dashboard?
Operational dashboards help you track key performance indicators (KPIs) that tell you how every operation in your business is performing, be it sales, marketing, or recruiting.
Via an operational dashboard, a sales manager could know about the performance of every sales rep working under him and a marketing VP can know about the recent content strategy performance.
But that's not just it; tracking operational KPIs plays a pivotal role in increasing operational efficiency, thus improving overall business profitability.
One major question that the operational dashboard answers is - “How are the different ongoing processes in your business performing?”
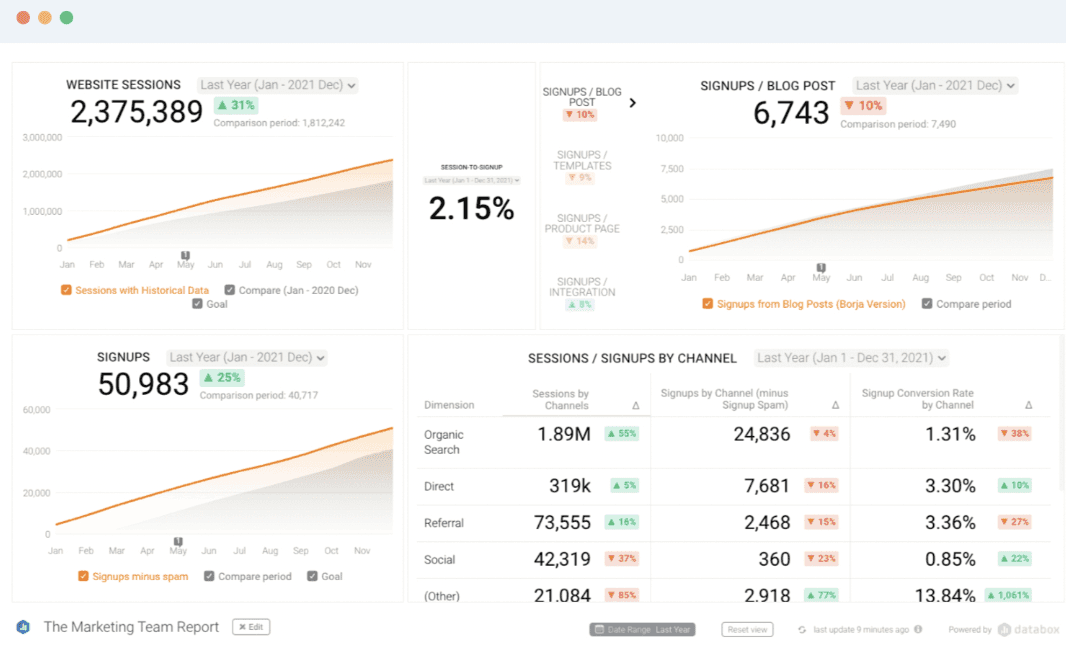
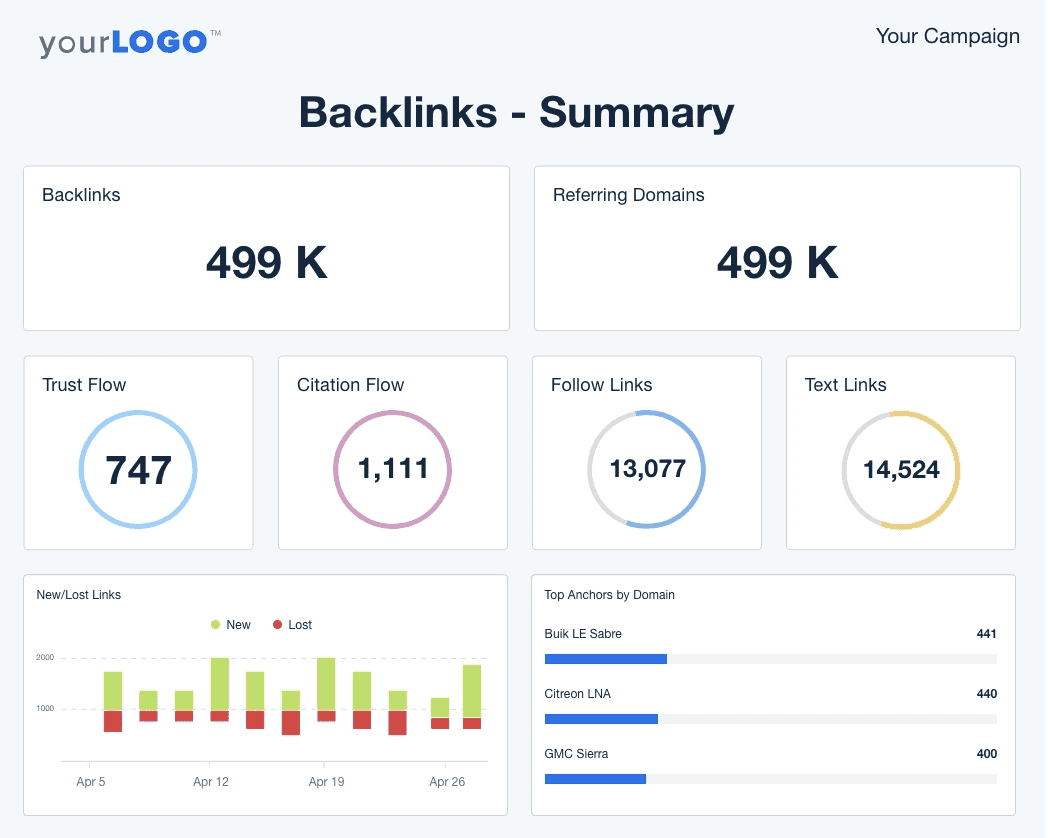
Here’s an operational dashboard example:
Now that you’ve understood what an operational dashboard tool is, you need to know how to choose the best one.
What to Look for When Choosing an Operational Dashboard Tool?
Here are three basic things you should look for while choosing an operational dashboard tool:
#1. Is It Easy for Your to Set It Up
Oftentimes, it becomes a tough job to set up dashboards on an operational dashboard tool because of its learning curve.
There will come a time, when you’ll realize that you’re spending more time learning about the platform than tracking KPIs.
Choose an operational dashboard software that allows you to set up dashboards within minutes if not seconds.
#2. Would It Give You Quick Access to Your Dashboards?
When you’re in a time-sensitive situation, you need an operational dashboard tool that lets you quickly open your dashboard, track KPIs, and talk to your team about it.
What if a KPI is out of its limits and needs immediate attention and you have to spend a significant amount of time just searching the dashboard that has the KPI you’re looking for.
Choose a software that has a search feature wherein you can type in the KPI’s name and get to it instantly.
#3. Can You Have Access on the Go?
The best way to have access to your KPIs on the go is by choosing an operational dashboard software that has a mobile app where you can build, track, and analyze KPIs.
With this you can save time and increase productivity of both you and your team.
Our app - Datapad gives you instant access to your KPIs on the go. Our mobile app lets you create a dashboard in seconds, import metrics from multiple data sources and one-click integrations, and lets you onboard your team to track KPIs from anywhere in the world.
What is the Best Operational Dashboard Tool to Stay on Top of Your Operations?
#1. Datapad
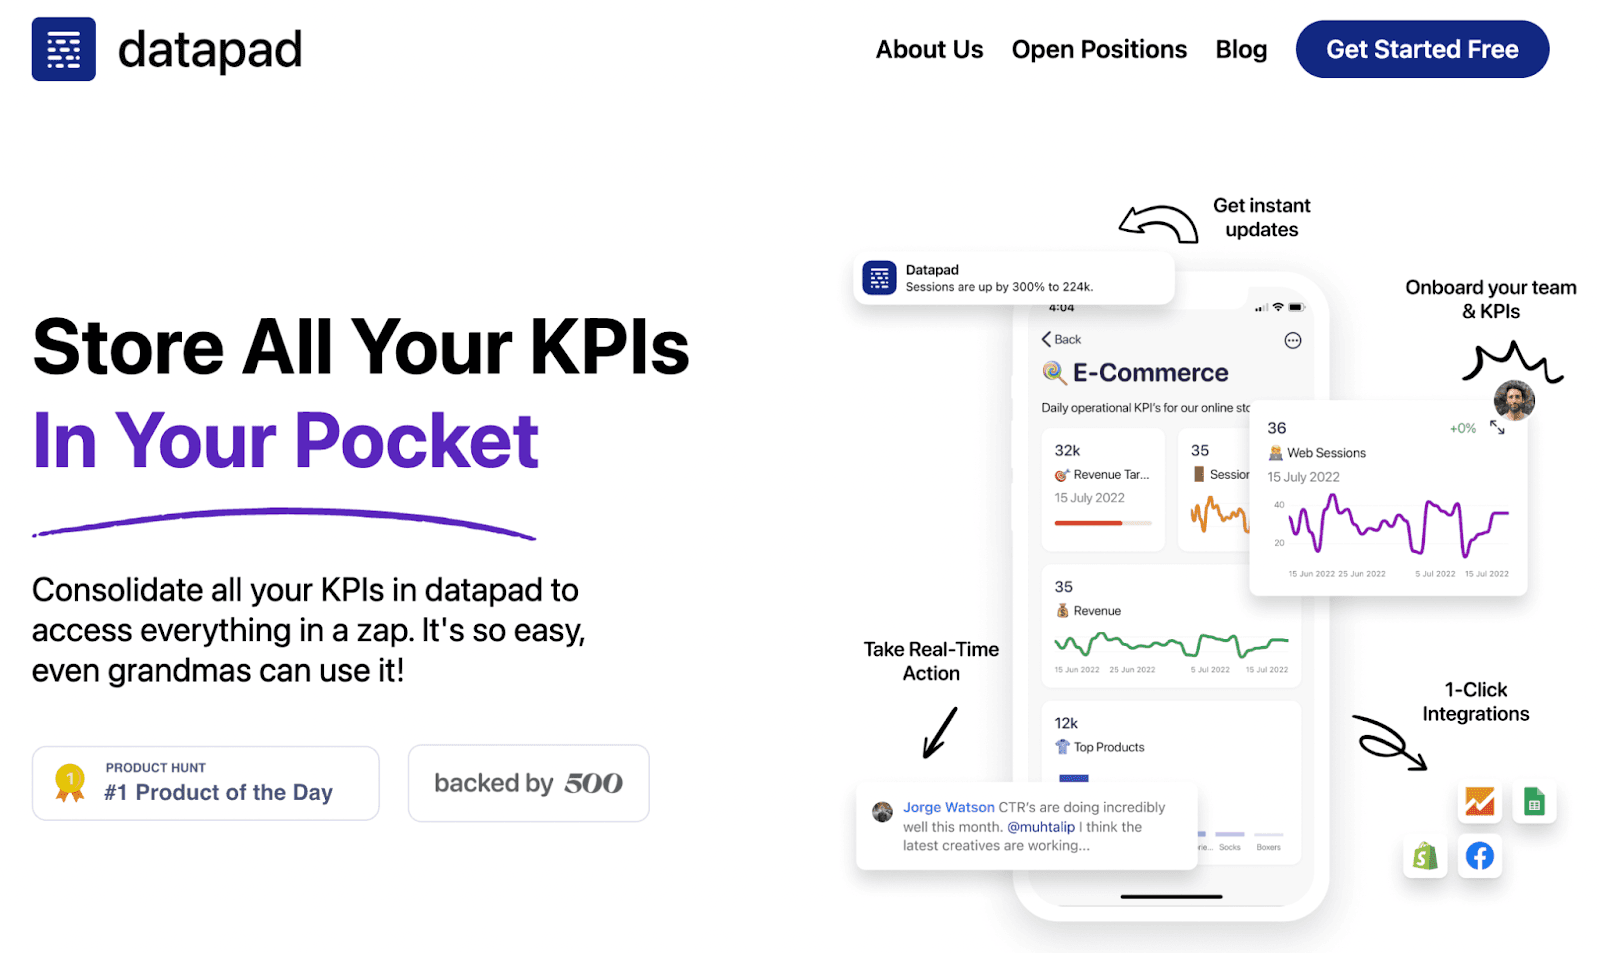
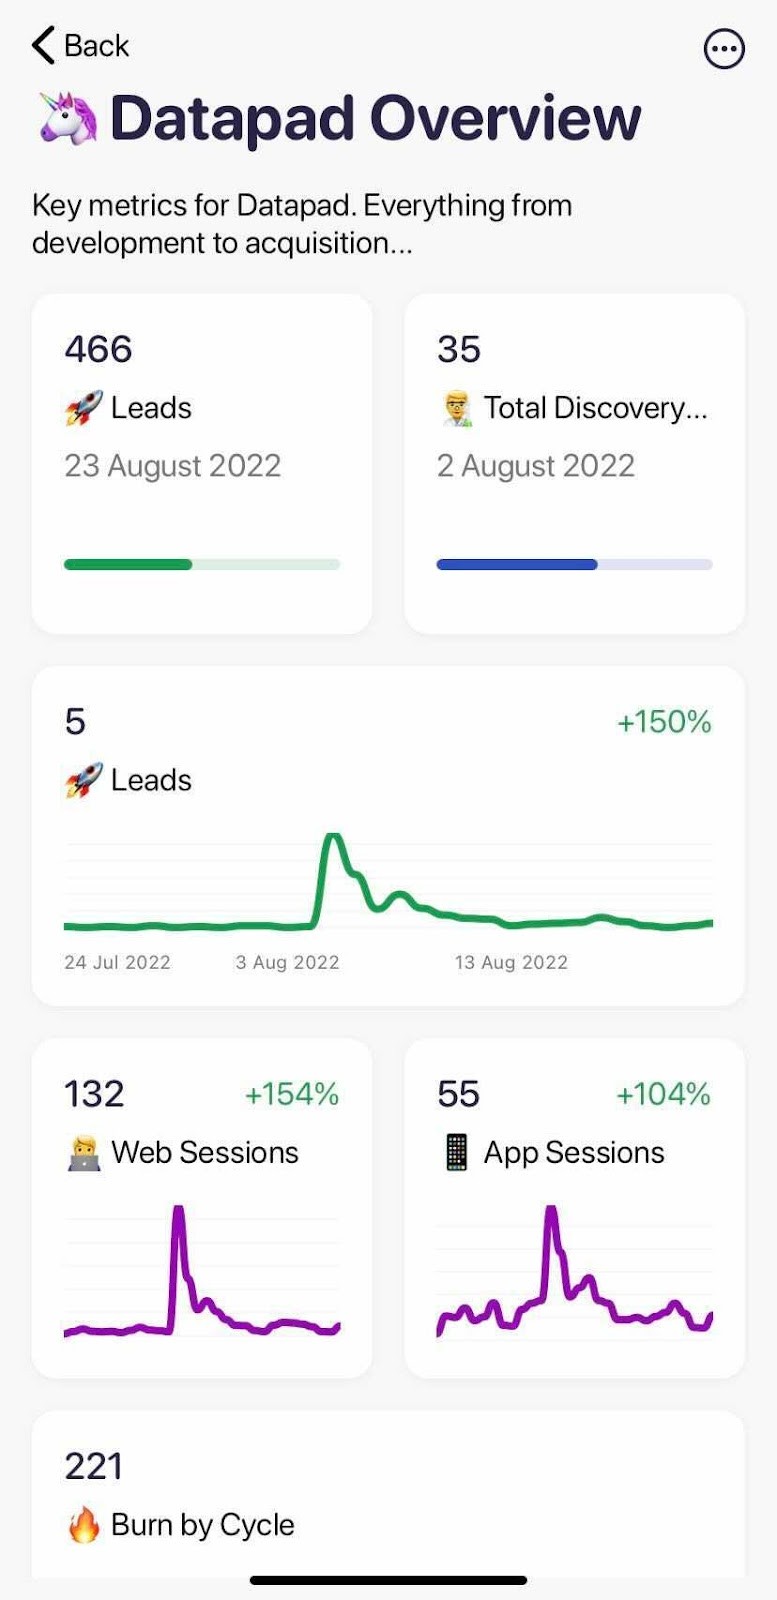
Datapad is a mobile-friendly KPI dashboard app (available for iOS and Android) that lets you build KPI dashboards from your mobiles in minutes, not hours.
Have you ever wondered how easy it would be if you could track KPIs on the go?
Imagine you’re in Disneyland with your family, enjoying the rides 🎢, but your team isn’t ‘enjoying.’
Your KPI tracking team just discovered a major flaw in one of the business KPIs and are bombarding you with messages.
What will you do? 🤔
Instead of telling your family to pack your bags and head home, you can just open the Datapad app on your mobile, track the KPI activity, and talk to your team on the app about a solution.
Who Is It For?
Datapad makes KPI tracking super easy. It doesn't matter whether you're a data specialist or not; Datapad makes KPI tracking fun and easy for everyone.
Features
#1. Team Collaboration
With Datapad, you can onboard your team and assign them tasks in minutes. You and your team can track individual KPIs, set strategic goals and benchmarks, and comment under each KPI to discuss more about them.

The feature comes in handy when a KPI shows an unusual behavior and your team needs to talk about it ASAP.
With Datapad’s team collaboration feature, you can:
-
Notify and get notified about all the KPI changes
-
Talk to your teammates via the comment section under each KPI you track
-
Get push notifications and alters when a KPI goes haywire
#2. Search KPIs Instantly
Datapad is built to make life easy for KPI trackers who’re short on time. Our app’s search feature lets you search for a specific KPI in the dashboard so you can get instant access to it.
Here’s how to do it:

#3. Data Import - Manual & Automatic
To track KPIs, you must have data first. For importing data into any dashboard app, integrations are a must.
Datapad integrates with the likes of Google Sheets, Google Analytics, Facebook Ads (and many more) so that you can import data around all your KPIs via one-click integrations.

But that’s not just it, there’s more!
If you have a very small dataset, you can just type in and import it manually. Yes, our app lets you do that too. 😊

With Datapad’s data import feature, you can:
-
Import data automatically via one-click integrations
-
Manually import data if you have a small dataset
Pricing
Datapad is a free-to-use app for any kind of mobile device. Just sign up to our app and start tracking KPIs like a pro!

#2. Geckoboard

Geckoboard lets you connect the data from various sources and convert them into a dashboard so that you don’t miss what’s relevant for you and your team.
More than 1000 data-driven organizations trust Geckoboard to ensure their team can focus on the important KPIs at the right time.
Who Is It For?
Geckoboard is for teams who want to track KPI on the big screen. It’s one of the best KPIs reporting tools if you have multiple KPIs to track.
Features
-
Has over 80 data sources integrations to instantly pull in data and turn them into dashboards
-
Simple and intuitive layout lets you resize, group, and arrange your data visualizations
-
Enables you to sort the exact metrics and ranges that make the most sense to track and analyze
-
Enables you to create dashboards that make a difference and share them via email, social media, CSV, pdf, etc
-
Allows analytical dashboards to display on large screens and TV mounted on a wall to see the bigger picture
Pricing
Geckoboard offers a free plan that allows business users to create a single spreadsheet-powered dashboard. Apart from that, it offers three paid plans:
-
Essential: $49/month
-
Pro: $99/month
-
Scale: $699/month

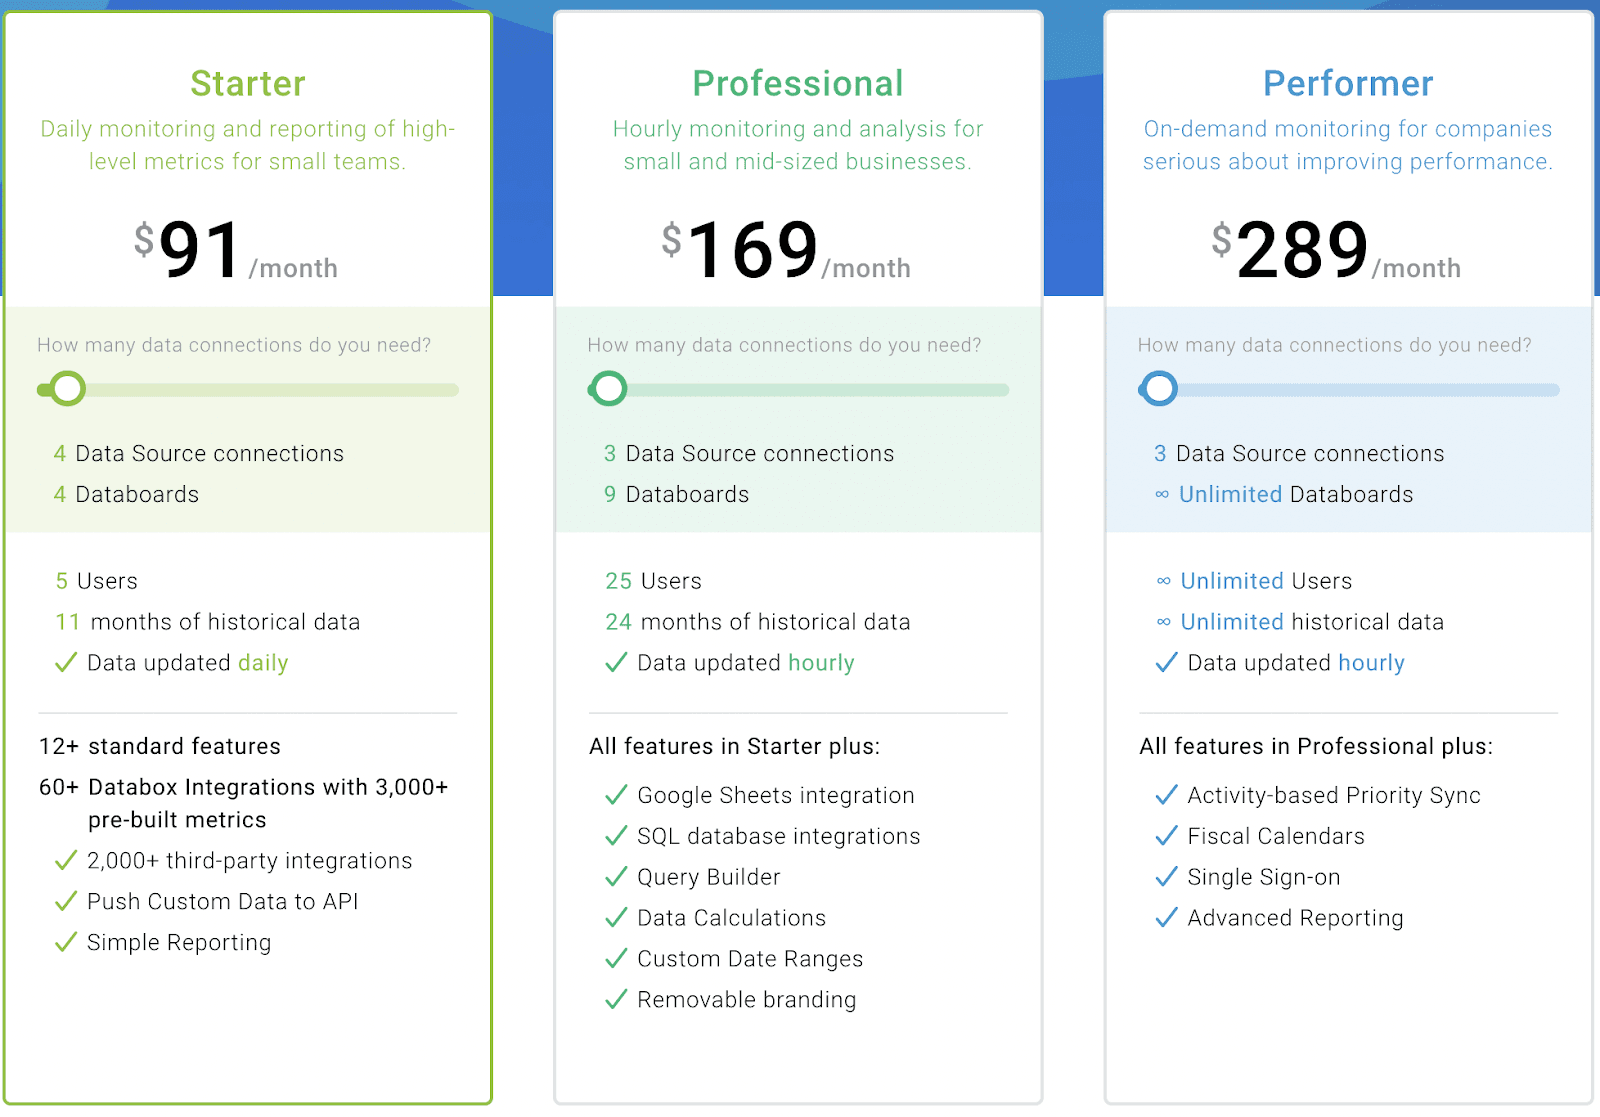
#3. Databox
It’s difficult to understand performance when you have to go through multiple platforms back and forth.
Databox makes it easier to visualize and analyze trends so that you and your team get a complete view of business performance in one place.
You can also customize your dashboard for each function in your organization to remove the guesswork, drill down on data and make the right decisions.
Who Is It For?
Databox is driven by a mission to make everyone understand performance by creating actionable dashboards. It provides high-quality metrics to small and mid-sized businesses.
Apart from that, it also offers special benefits to marketing agencies by letting them create white-labeled reports.
Features
-
70+ integrations that let you import data easily and view the most important KPIs instantly
-
Drag and drop builder lets you arrange KPIs in the dashboard with zero coding
-
Has a library of over 300 pre-built dashboard templates with commonly used KPIs to get instant metric visualization
-
Get instant alerts about the performance of KPIs via email, mobile, or Slack so that you don't miss updates that matter the most
-
Special agency feature to automate client management so you can focus more on execution and strategy
Pricing
You can try the free forever plan of Databox and start tracking KPIs with more than 60 integrations. Besides that, the platform has three paid plans:
-
Starter: $91/month
-
Professional: $169/month
-
Performer: $289/month
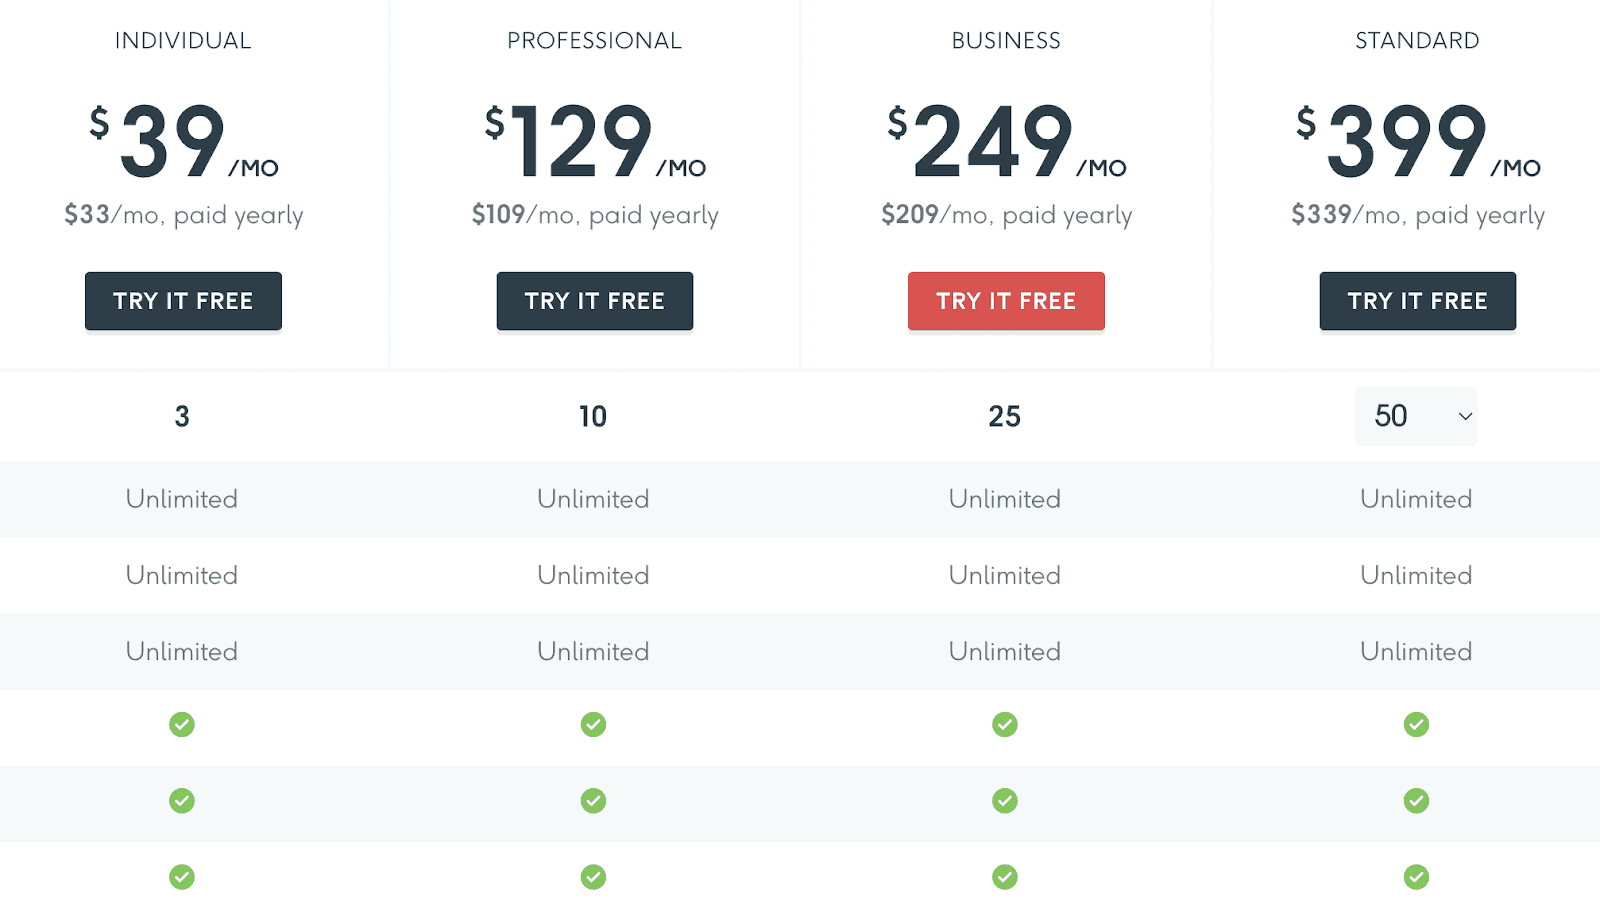
#4. DashThis

DashThis is a time-saving automated reporting tool that helps marketers and agencies combine all the marketing data into a single report in the blink of an eye.
The software is used by over 18,000 users in more than 122 countries, making it one of the most popular reporting tools worldwide.
Who Is It For?
Whether you're a freelance digital marketer or a large marketing agency, creating manual reports is a tedious task. With DashThis, you can automate KPI reporting in no time so that you focus on growing your business.
Features
-
Pulls data from more than 34 integrations like Facebook, Google Ads, Twitter, and others so that you're on the right track
-
Has a wide selection of pre-built reports templates filled with some of the commonly used KPIs that save time
-
The clone feature allows you to replicate similar reports for another client any number of times
-
Offers easy sharing options for your reports via email and URL to your team and clients
-
Kick things up a notch with advanced customized widgets that speaks your brand’s voice
Pricing
DashThis offers four paid plans to choose from:
-
Individual: $39/month
-
Professional: $129/month
-
Business: $249/month
-
Standard: $399/month
You can also try it for free; its free plan offers 10 dashboards for 15 days.
#5. AgencyAnalytics
AgencyAnalytics has everything to save you from the exhaustive and unnecessary hours of updating your sprawling spreadsheets for manual reporting.
It automates client reporting in minutes and creates customizable dashboards that gather all your client's data in one place.
Who Is It For?
AgencyAnalytics is specially designed for marketing agencies to save time and boost their revenue. It doesn’t matter whether you’re getting started or an established agency, the platform offers a full suite of features to streamline KPI reporting.
Features
-
Has more than 70 integrations to gather and connect all your client’s data under one roof
-
Offers a set of fully customizable widgets enabling you to build reports that give a personalized touch to your clients
-
Has a full suite of white labeling capabilities that boosts your brand image
-
The goal feature makes tracking client’s success easier by adding your campaigns to custom dashboards
Pricing
You can try the platform for free for 14 days. However, if you want more, you can go for its paid plans which are as follows:
-
Freelancer: $12/month
-
Agency: $18/month
-
Enterprise: Contact the sales team for price

#6. Plecto
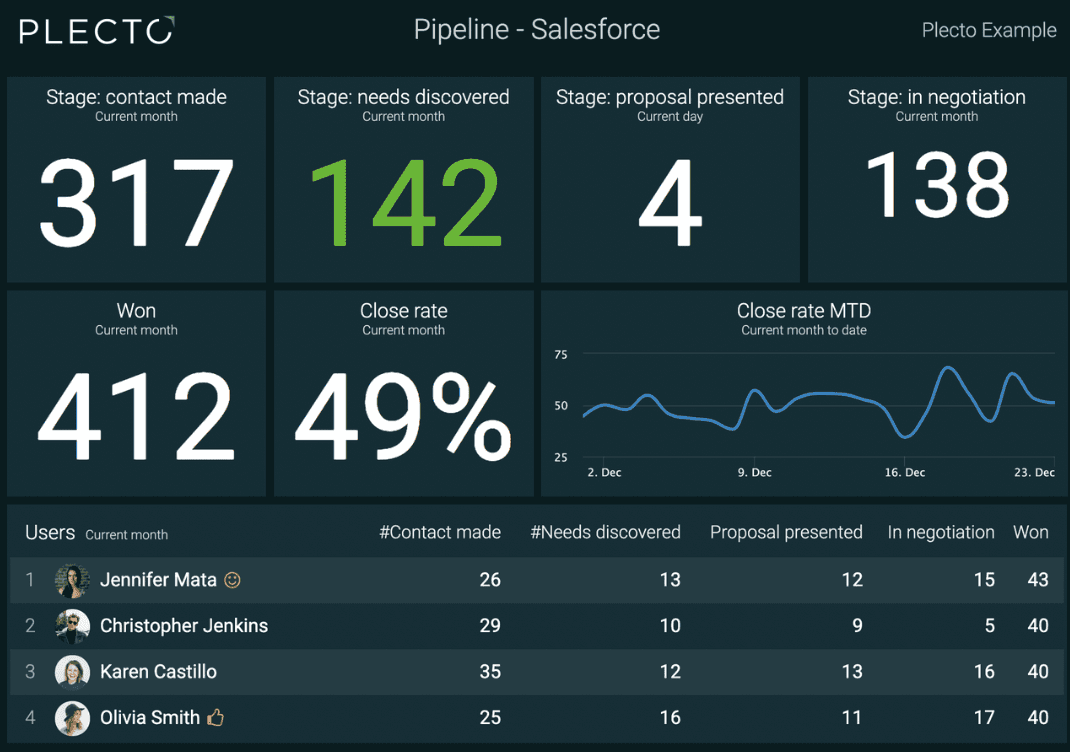
Plecto is a dashboard software that enables real-time data visualization and empowers everyone in your team to engage in your company’s growth.
It combines the power of KPI visualization, gamification, and coaching tools to boost your team’s performance in an engaging way.
Who Is It For?
Plecto is an engagement and motivation platform that allows organizations and individuals to perform at their maximum potential. Anyone can use it without any prior knowledge of coding and business intelligence skills.
Features
-
Helps in real-time KPI visualization across multiple systems so that you can stay on top of your business
-
Real-time performance updates of employees on TV screens encourage engagement and keep them motivated
-
Has more than 200 pre-built popular widgets that let you set up a complete dashboard in minutes
-
Lets you compile every relevant KPI into one single report for accurate analysis
-
Allows you to create fun and personalized competitions at work to boost employee motivation
Pricing
Plecto offers three paid plans:
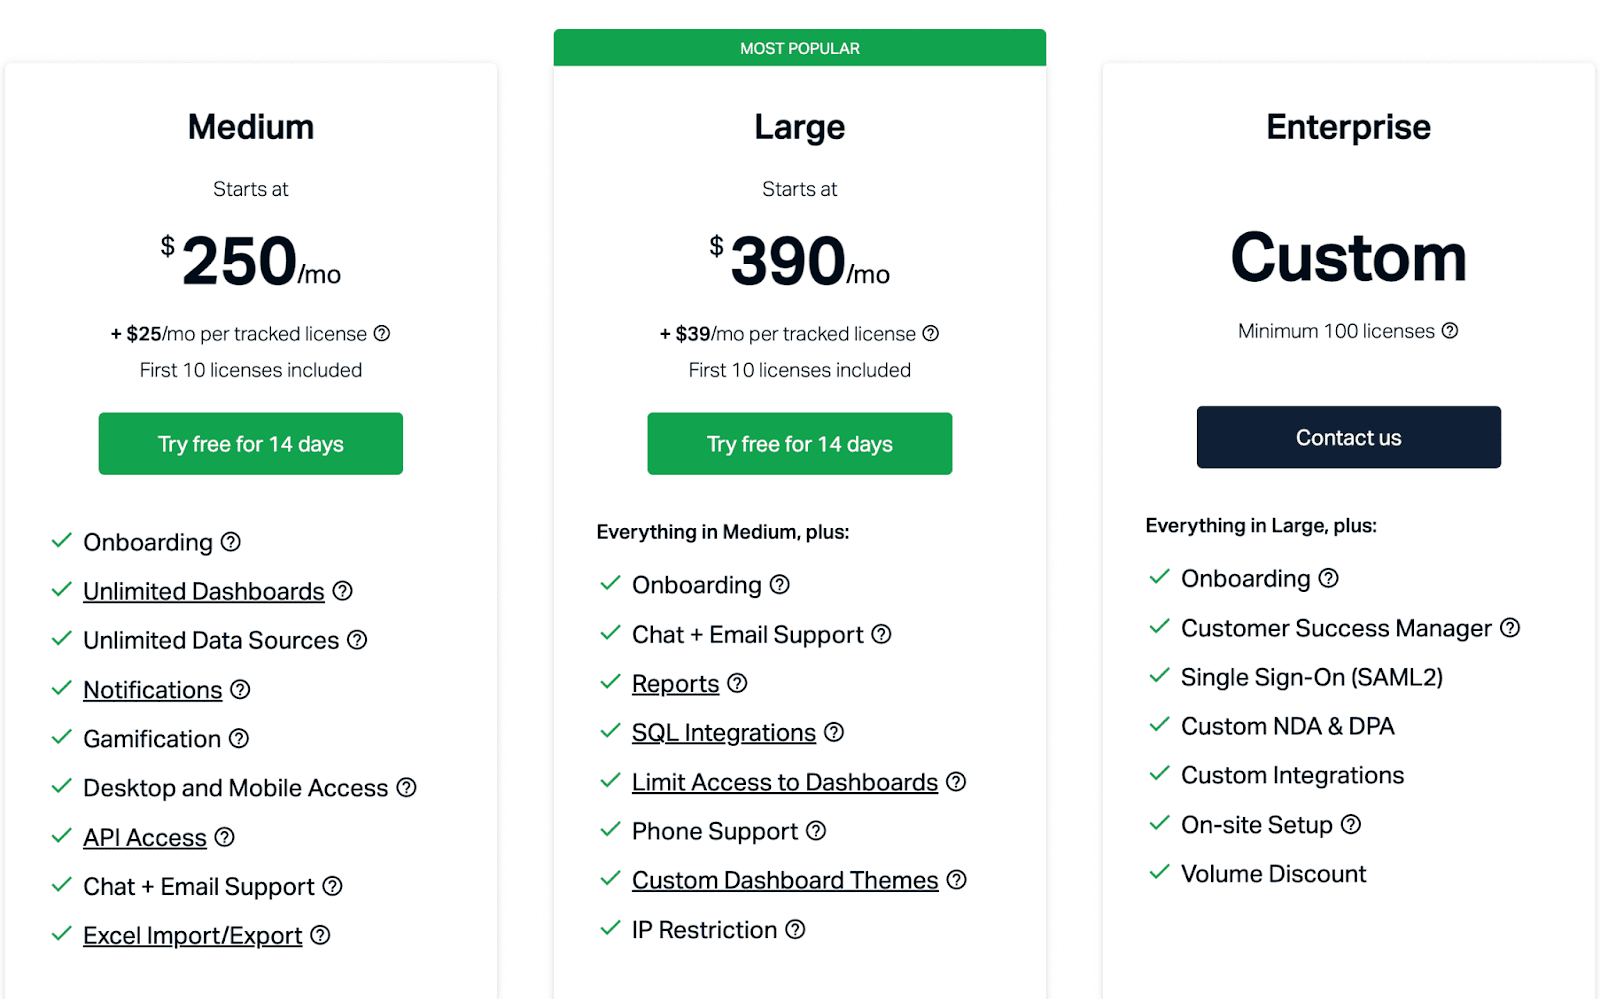
-
Medium: $250/month
-
Large: $390/month
-
Enterprise: Contact the sales team
#7. Klipfolio
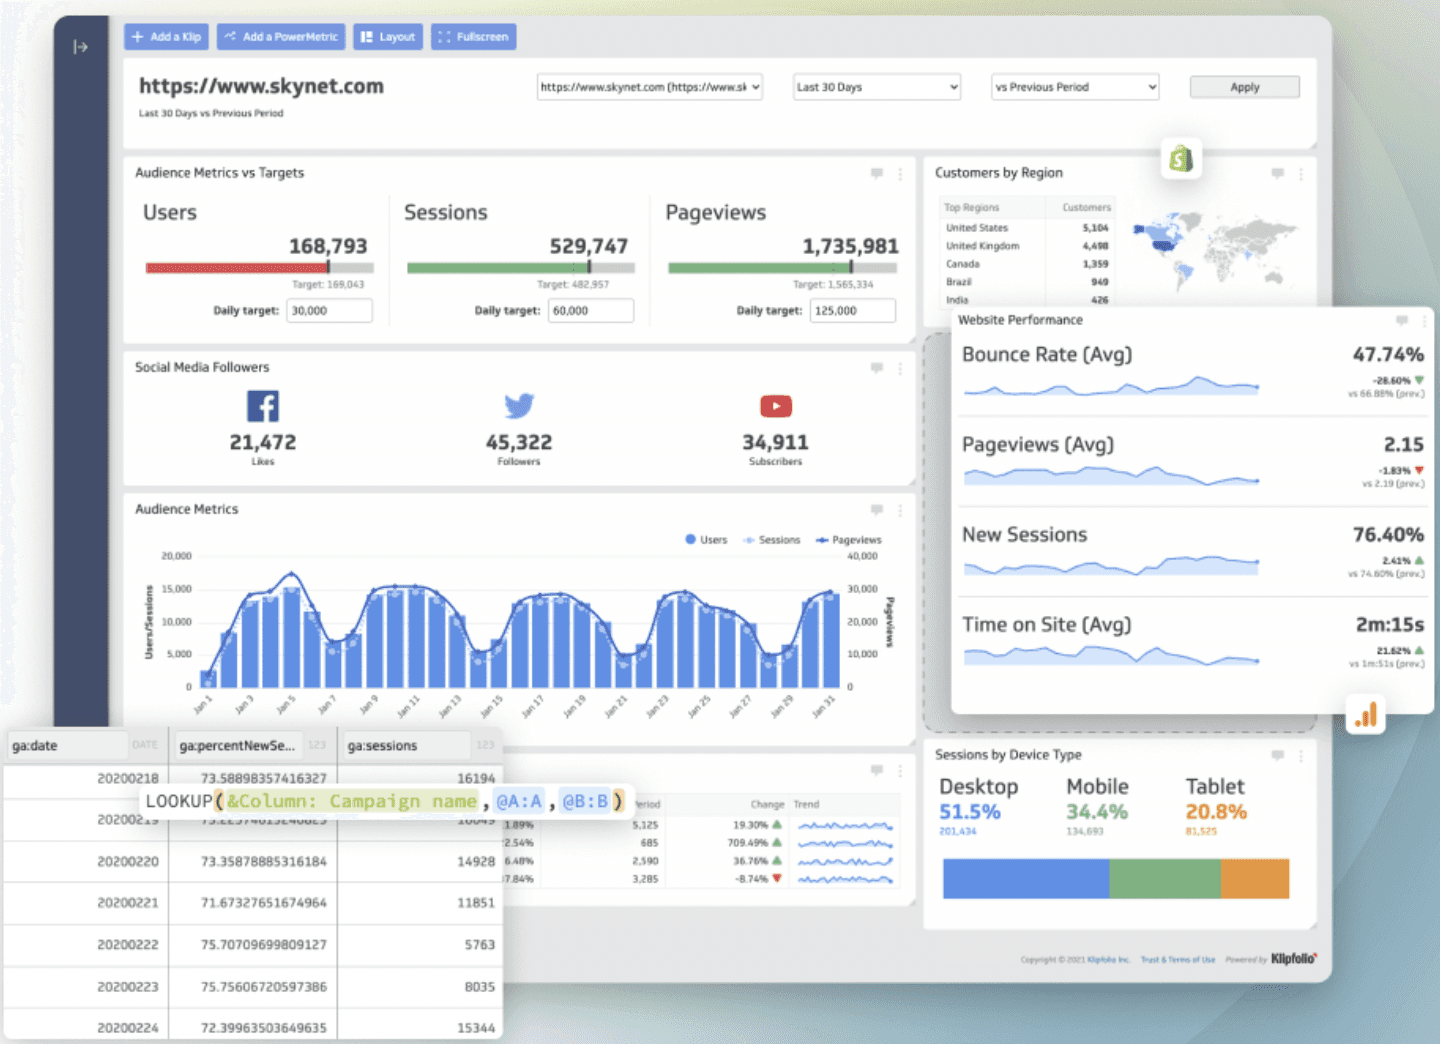
Going through thousands of rows in a spreadsheet to find relevant data is like finding a needle in a haystack.
Klipfolio brings all your important metrics to a single dynamic platform that helps you ease the process of tracking KPIs.
Who Is It For?
Klipfolio is for everyone, from small businesses to non-profit organizations, it helps to scale your business with confidence.
Features
-
Has over 100 pre-built Klip templates and more than 10 dashboard templates to build custom dashboards for your team
-
Lets you import data safely whichever way you want from various sources
-
Robust data modeler lets you modify, segment, filter, and visualize data for informed decision-making process
-
Notifies you of recurring or threshold goals via WhatsApp and email so that you can take early measures
-
Power Metric feature stores historical data and allows you to look back and identify the trends over time
Pricing
You can get started with Klipfolio for free, but if you want to unleash the tool’s ultimate potential, here are the paid plans it offers:
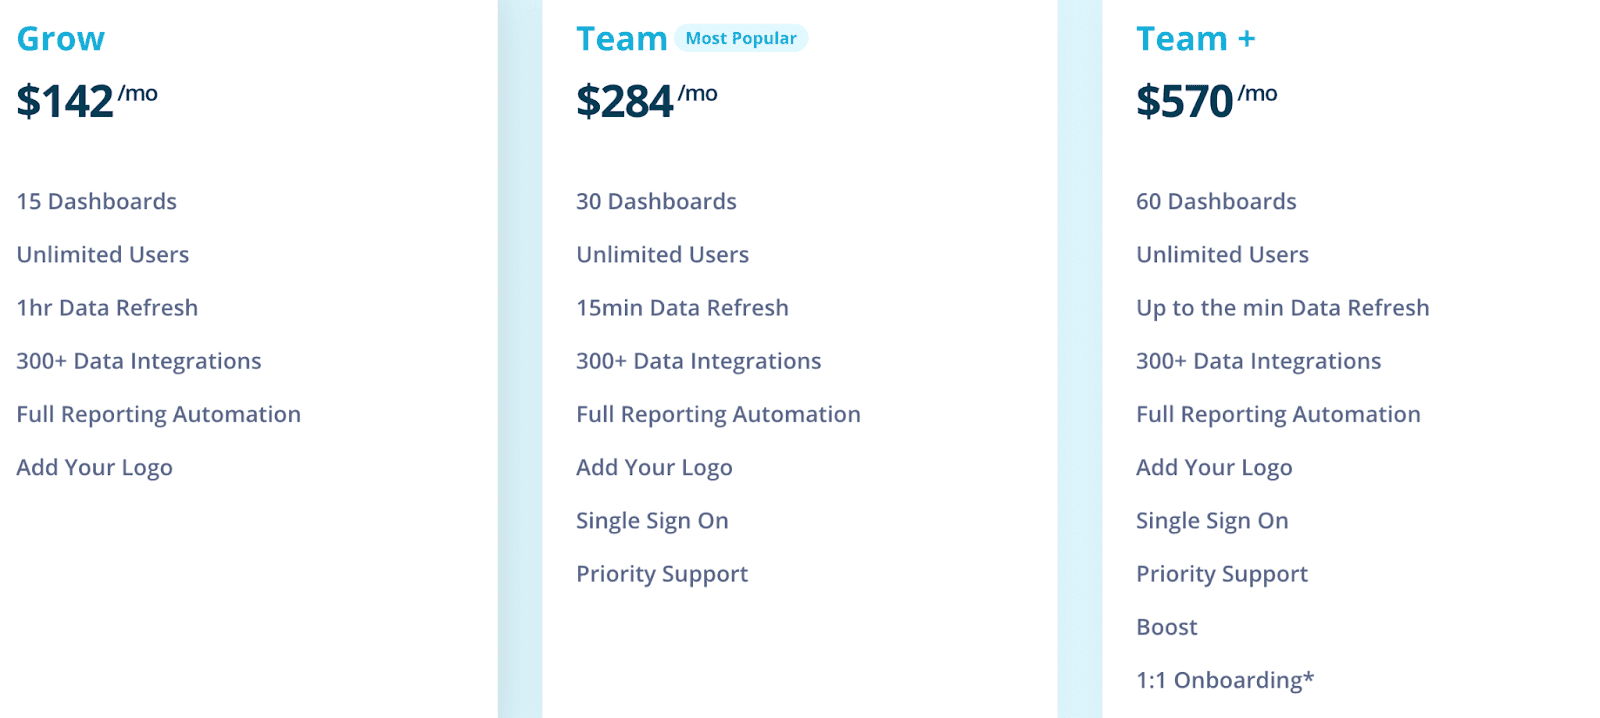
-
Grow: $142/month
-
Team: $284/month
-
Team+: $570/month
#8. Cyfe

Cyfe is an all-in-one business dashboard tool that lets you monitor and visualize all your data in one place so that you and your team can understand what's important.
Highly recommended by G2 Crowd and TrustRadius, it’s a trusted dashboard platform that lets you analyze all your business data in an organized manner.
Who Is It For?
Cyfe lets business owners and solopreneurs build dashboards to combine data sources and identify trends with a special focus on agencies.
Features
-
More than 100 pre-built widgets that let you import data from various sources and quickly start KPI tracking
-
Widget alerts keep you notified about different metrics via email and SMS
-
Several white label options provide flexibility and control over your reports
-
Integrates with Zapier and allows you to customize your data dashboard according to your needs
-
Dashboard can be translated into 15 languages so that everyone can understand what’s important
Pricing
Cyfe offers four plans:
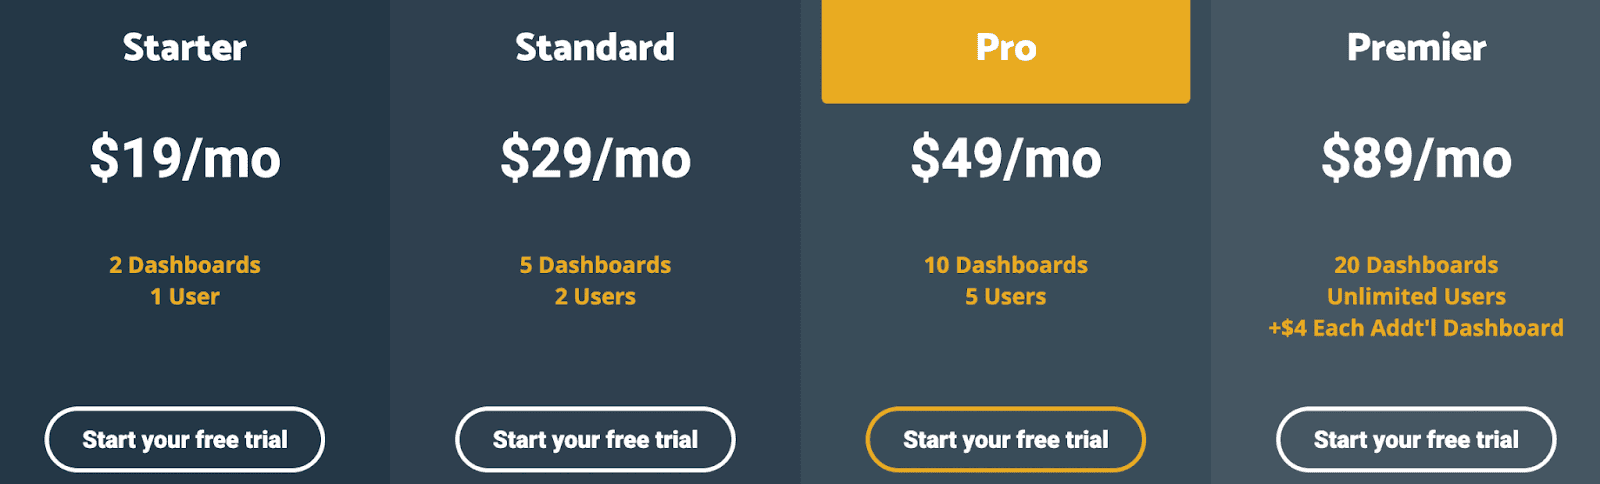
-
Starter: $19/month
-
Standard: $29/month
-
Pro: 49/month
-
Premier: $89/month
#9. Dundas BI
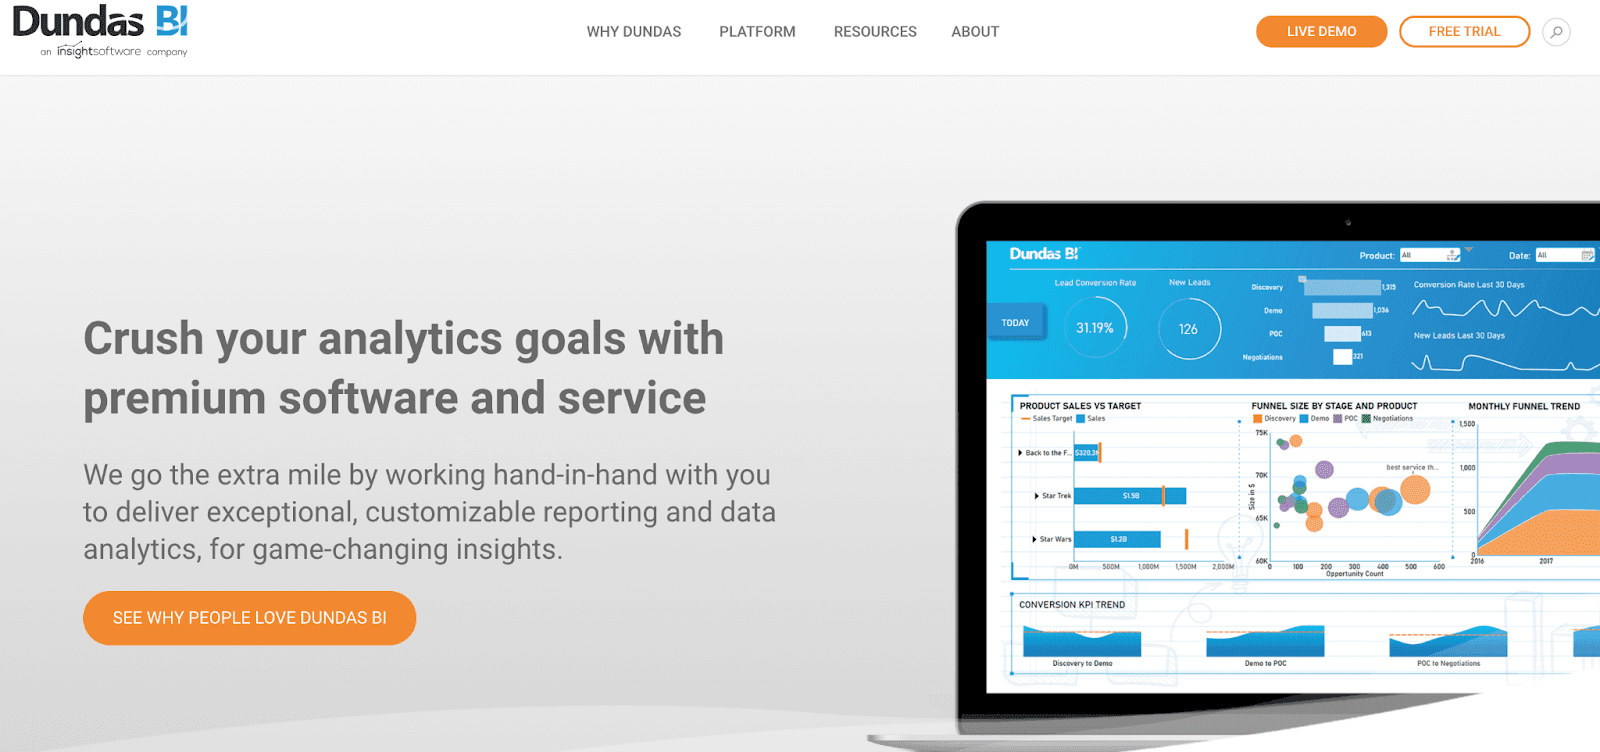
Dundas BI is an end-to-end business intelligence platform that transforms raw data into dashboards that empowers everyone to make critical business decisions.
What makes this platform different from others is its unmatched flexibility and the ability to adapt to your needs.
Who Is It For?
From large and mid-sized companies to software vendors, everyone can use the platform to make more informed business decisions in real-time.
Features
-
Easy drag and drop feature lets you build a web-based customizable dashboard so that you can access your data from anywhere
-
Lets you annotate the metrics with questions and comments so that you can see your data properly
-
Smart and interactive data visualizations help users to understand data better and faster
-
Ad Hoc reporting tools enable business owners to quickly access critical business information to make fast decisions
-
The open and flexible nature of the platform allows easy integration into existing systems and works like any other applications
Pricing
Dundas BI offers flexible pricing that maximizes your investment. You can request a custom plan tailored to your business needs by contacting their sales team.

#10. Inetsoft
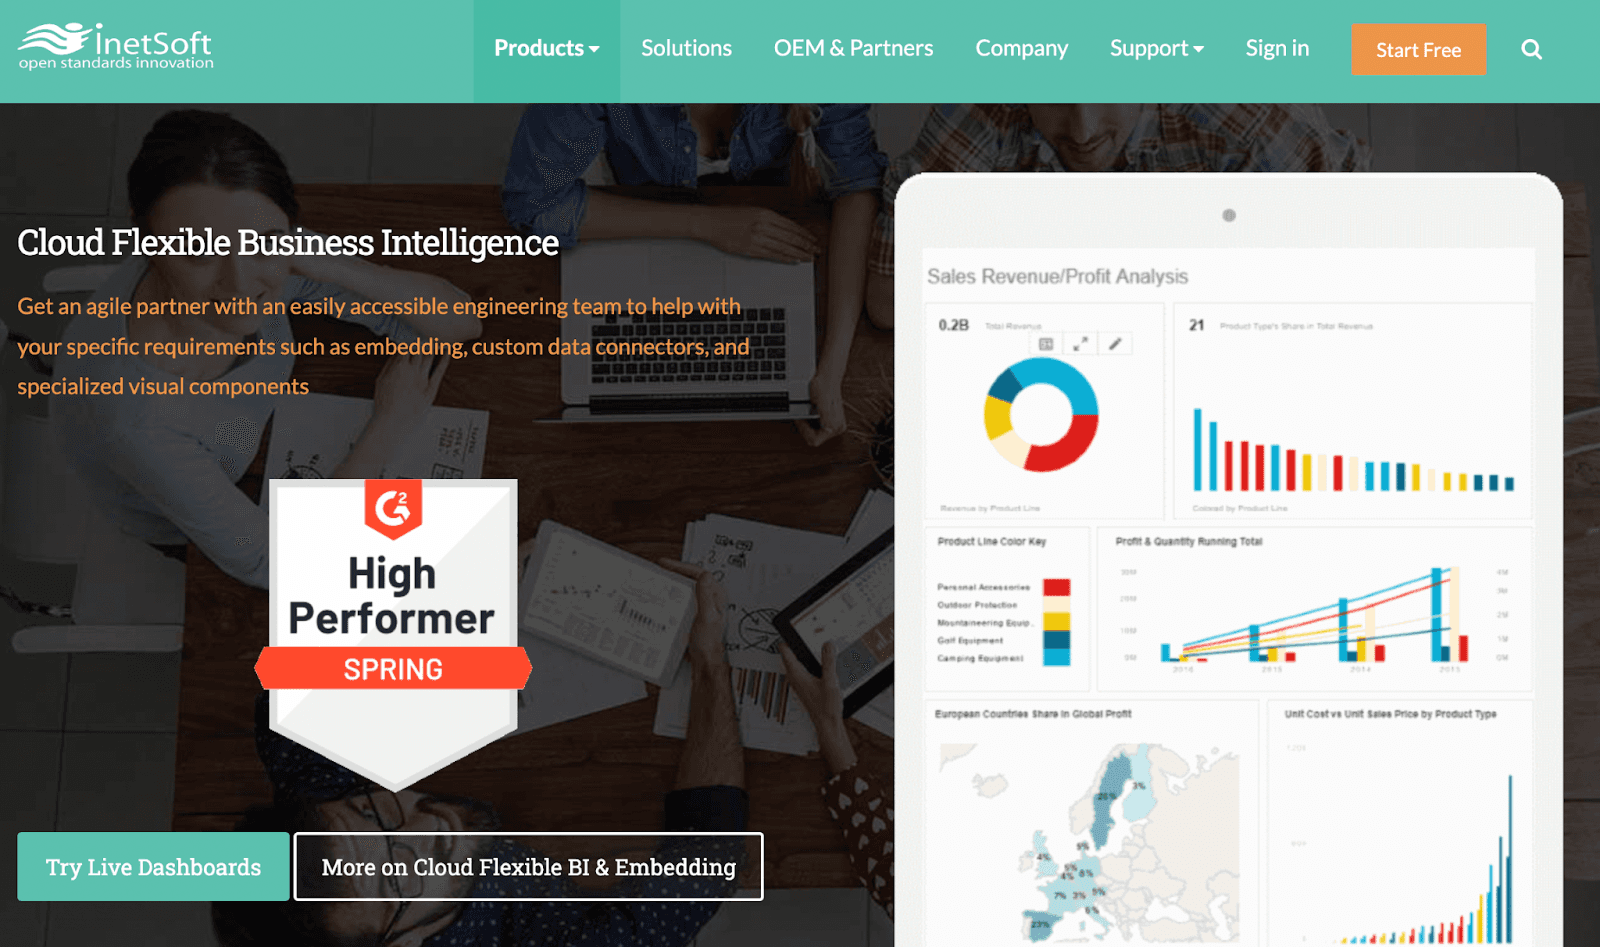
Inetsoft offers a cloud-flexible business intelligence solution that redefines reporting and data analytics, especially for SaaS-based companies.
Who Is It For?
Inetsoft provides powerful solutions across many industries, but it's most beneficial for SaaS-based companies. Apart from that, it also offers flexible data solutions to OEM partners.
Features
-
Data mashup technology enables end users and designers to have an overview of their business performance
-
Self-service analytics with auto-wired visualizations allows users to calculate and change data that offers a new perspective
-
Has multiple integrations that help you and your company with data modeling, transformation, and get other essential insights
Pricing
Inetsoft offers free plans for both businesses and individuals. Apart from that, you can also enjoy premium features with the paid plans, which are
-
Growth: $165/month
-
Enterprise: Contact the sales team for customized pricing

#11. Tableau
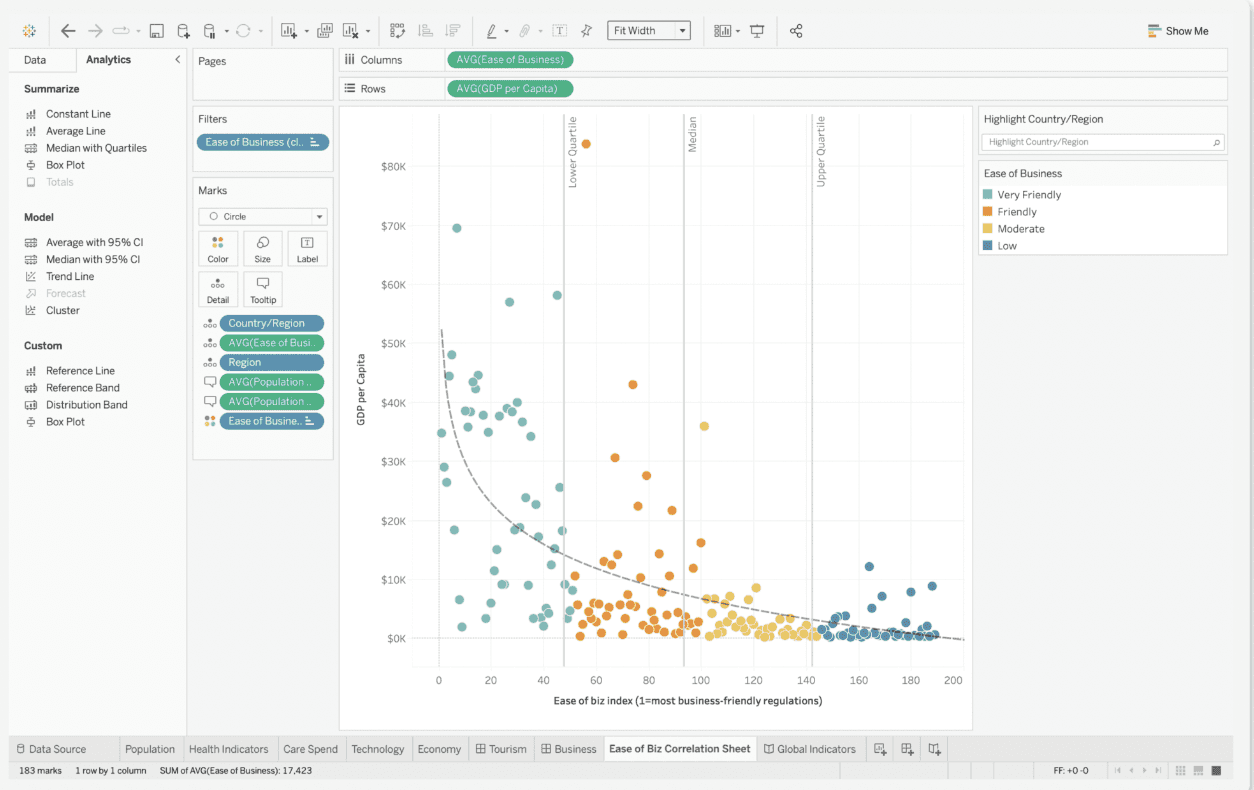
Tableau empowers people and organizations to access and monitor their data to remove the guesswork and make fact-based choices.
It’s a leading analytics platform that has changed the face of more than 1400 businesses around the world.
Who Is It For?
Whether you work in HR, IT, or any other field, Tableau helps to build a data culture that could solve your toughest data problems.
Features
-
Tableau Clouds, a fully hosted self-service platform, lets you track all the important KPIs to make educated business decisions
-
Tableau Desktop lets you access, monitor, and visualize your data for faster and deeper insights
-
Tableau Server enables safe data exploration in risk-free zone
-
Tableau Public, the world's largest collection of data visualizations, provides you the opportunity to learn from the right people
-
Native integrations gather all your data no matter where they reside
Pricing
Tableau offers 3 pricing plans - Creator, Explorer, and Viewer. However, you have to contact the sales team for their pricing.

The Best operational dashboard Software to Track KPIs with Ease
Tracking KPIs is a recurring process, and you must spend a lot of time analyzing them. To save time, you need operational dashboard software that lets you track KPIs on the go. Our tool Datapad lets you do just that!
With Datapad, you can track KPIs from your mobile phones, all you need is a stable internet connection.
We also let you onboard your team in seconds and start assigning them KPIs to track and communicate with them in real-time.
Get started with Datapad for free, and get the feel of tracking KPIs from the mobile phone from anywhere in the world.
Frequently Asked Questions (FAQs)
Q1. What is an operational dashboard tool?
An operational dashboard tool lets you track KPIs related to every process that’s running in your company. For example, if one of the traffic sources of your company’s website is Ads; operational dashboard helps you track KPIs like - demographics, CTR, CPC, CAC, etc.
Q2. What are the different types of KPI dashboards
There are three different types of dashboards:
-
Operational
-
Strategic
-
Analytical
Select the tool that has all the four features.
Q3. What are the five best operational dashboard software of the 11 discussed above?
-
Datapad: Track, search, and analyze KPIs on your mobile from anywhere in the world
-
Geckoboard: Cast KPIs on big TV screen and analyze them better
-
DashThis: Maily build for agencies to send out white-lable reports
-
Plecto: Gamilfy KPI tracking and make it fun for you and your team
-
AgencyAnalytics: Automate report sending and white label reports in minutes